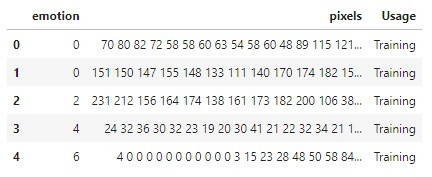
昨天我們介紹了FER2013表情資料集,今天要來讀取資料與做探索性資料分析。
你應該要有一個fer2013.csv,與你的python程式碼放在同一個資料夾中。
import pandas as pd
import numpy as np
import os
import matplotlib.pyplot as plt
由於原始資料是長度為2304的字串,每個數字以空格隔開,
所以我們使用np.fromstring把字串轉成numpy array,
再用np.reshape轉成2維陣列,視為圖片的矩陣。
def prepare_data(data):
    """ Prepare data for modeling
        input: data frame with labels and pixel data
        output: image and label array """

    image_array = np.zeros(shape=(len(data), 48, 48, 1))
    image_label = np.array(list(map(int, data['emotion'])))

    for i, row in enumerate(data.index):
        image = np.fromstring(data.loc[row, 'pixels'], dtype=int, sep=' ')
        image = np.reshape(image, (48, 48, 1))  # 灰階圖的channel數為1
        image_array[i] = image

    return image_array, image_label
fer2013.csv只有3個欄位,分別是:

有些小夥伴會問:我們不是要做EDA嗎?為甚麼要分開資料集呢?
當然!不管是PublicTest還是PrivateTest,都是我們未知的資料,
實務上來說,我們不會獲得測試集的數據,更不可能獲得測試集的標籤。
所以我們要在假裝看不見測試集的情況下去理解資料。
通常是把訓練集再拆分一些出來成為驗證集,以驗證集代替測試集去檢驗模型。
但在這裡我們將公開測試集當作驗證集、私人測試集當測試集。
X_train, y_train = prepare_data(df_raw[df_raw['Usage'] == 'Training'])
X_val, y_val = prepare_data(df_raw[df_raw['Usage'] == 'PublicTest'])
X_test, y_test = prepare_data(df_raw[df_raw['Usage'] == 'PrivateTest'])
訓練、驗證和測試集的比例為8:1:1,非常經典~
df_raw['Usage'].value_counts()  # 8:1:1
# output:
# Training       28709
# PrivateTest     3589
# PublicTest      3589
# Name: Usage, dtype: int64
歷經了重重困難(大約15分鐘),
終於可以觀察到活生生的表情圖片了!
def plot_one_emotion(data, img_arrays, img_labels, label=0):
    fig, axs = plt.subplots(1, 7, figsize=(25, 12))
    fig.subplots_adjust(hspace=.2, wspace=.2)
    axs = axs.ravel()
    for i in range(7):
        idx = data[data['emotion'] == label].index[i]
        axs[i].imshow(img_arrays[idx][:, :, 0], cmap='gray')
        axs[i].set_title(emotions[img_labels[idx]])
        axs[i].set_xticklabels([])
        axs[i].set_yticklabels([])

emotions = {0: 'Angry', 1: 'Disgust', 2: 'Fear',
            3: 'Happy', 4: 'Sad', 5: 'Surprise', 6: 'Neutral'}
for label in emotions.keys():
    plot_one_emotion(df_train, X_train, y_train, label=label)


def plot_distributions(img_labels_1, img_labels_2, title1='', title2=''):
    df_array1 = pd.DataFrame()
    df_array2 = pd.DataFrame()
    df_array1['emotion'] = img_labels_1
    df_array2['emotion'] = img_labels_2

    fig, axs = plt.subplots(1, 2, figsize=(12, 6), sharey=False)
    x = emotions.values()

    y = df_array1['emotion'].value_counts()
    keys_missed = list(set(emotions.keys()).difference(set(y.keys())))
    for key_missed in keys_missed:
        y[key_missed] = 0
    axs[0].bar(x, y.sort_index(), color='orange')
    axs[0].set_title(title1)
    axs[0].grid()

    y = df_array2['emotion'].value_counts()
    keys_missed = list(set(emotions.keys()).difference(set(y.keys())))
    for key_missed in keys_missed:
        y[key_missed] = 0
    axs[1].bar(x, y.sort_index())
    axs[1].set_title(title2)
    axs[1].grid()

    plt.show()

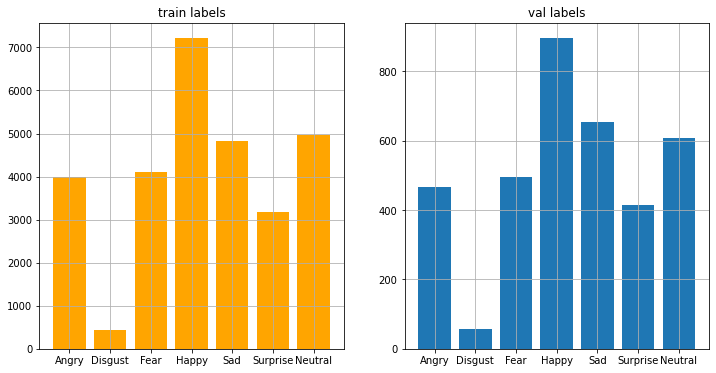
plot_distributions(
    y_train, y_val, title1='train labels', title2='val labels')
資料不平衡的問題苦惱著各個資料科學家,
今天我們發現disgust類別特別少,happy類別特別多。
可能是因為人類是一個友善的族群,
所以當時在蒐集照片時大多是笑臉吧!
