
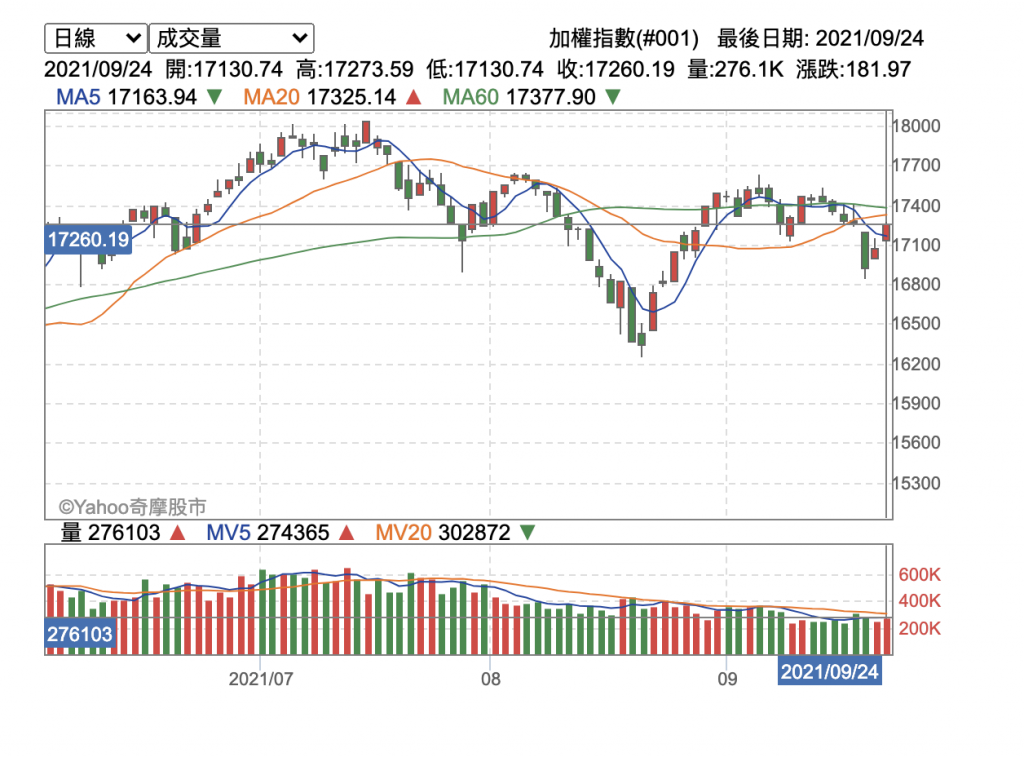
做完 K 線完成後,就是做均線,常見大盤走勢圖如下,在這些 K 棒的圖上,通常會有數條(通常三條)線會和這些 K 棒交錯,這些線是均線。MA5 就是5日的平均,也稱週線。MA20 就是 20 日的平均,也稱月線。MA60 就是三個 20,所以稱季線。再上去還有半年線和年線。
均線的介紹如下,我們這邊要實作的會是簡單移動平均線。
https://zh.wikipedia.org/wiki/移動平均
葛蘭碧八大法則
https://www.moneydj.com/z/analyst/ma.htm
使用價格和均線當指標,依照均線和價格交錯的時機,做股票的進出,更詳細的說明可以在網路上找到大量的資料
移動平均線是要和 K 線畫在同一張圖上的,但之前我們做的 K 線圖,用的是 CandleStickChartView,這個類別是沒辦法設定 Line 的 Data的,所以,我們要將 CandleStickChartView 轉換成 CombinedChartView。 CombinedChartView 可以顯示複數種類的 Data,如果你想,是可以把 Line, Bar, Candle 全部畫上去的。
所以,之前的純 CandelChart 相關功能,已經從 VC 收進 ChartsAdapter 內了,所以 VC 在 private func setupCandleView() 要更改的,只是呼叫 chartsAdapter 內的方法,去得到 CombinedChartView。
開出 ChartsAdapter 中 CombinedChartView 相關的 func,讓 VC 呼叫。
// MARK: - Combine Charts 相關 func
extension ChartsAdapter {

    func getCombineChartView() -> UIView {
        let view = CombinedChartView()
        setupCombinedChartView(view)
        return view
    }

    private func setupCombinedChartView(_ chartView: CombinedChartView) {

        chartView.dragEnabled = false
        chartView.setScaleEnabled(true)
        chartView.maxVisibleCount = 1000
        chartView.pinchZoomEnabled = true

        chartView.legend.horizontalAlignment = .right
        chartView.legend.verticalAlignment = .top
        chartView.legend.orientation = .vertical
        chartView.legend.drawInside = false
        chartView.legend.font = UIFont.systemFont(ofSize: 10)

        chartView.leftAxis.labelFont = UIFont.systemFont(ofSize: 10)
        chartView.leftAxis.spaceTop = 0.3
        chartView.leftAxis.spaceBottom = 0.3
        chartView.leftAxis.axisMinimum = 0

        chartView.rightAxis.enabled = false

        chartView.xAxis.labelPosition = .bottom
        chartView.xAxis.labelFont = UIFont.systemFont(ofSize: 10)
        chartView.xAxis.labelCount = 10
    }
}
下方是這次 D1 ~ D12 的完成品,可以下載來試


 iThome鐵人賽