今日本篇重點是要如何安裝Metricbeat,以設定啟用模組服務來收集資料。
步驟一: 下載Metricbeat安裝包, 下載地址。
curl -L -O https://artifacts.elastic.co/downloads/beats/metricbeat/metricbeat-7.14.1-darwin-x86_64.tar.gz
tar xzvf metricbeat-7.14.1-darwin-x86_64.tar.gz
cd metricbeat-7.14.1-darwin-x86_64/
步驟二: 修改配置檔案metricbeat.yml。
output.elasticsearch:
  hosts: ["localhost:9200"]
  username: "elastic"
  password: "<password>"
setup.kibana:
  host: "localhost:5601"
步驟三:設定要啟動的模組。
##啟動語法
##metricbeat modules enable module_name
./metricbeat modules enable docker
步驟四:安裝Metricbeat內建的Dashboard範本。
./metricbeat setup
步驟五:啟動 metricbeat。
./metricbeat -e
接下來就可以到kibana介面查看Metricbeat收集到的資訊,是否有正常傳送到elasticsearch。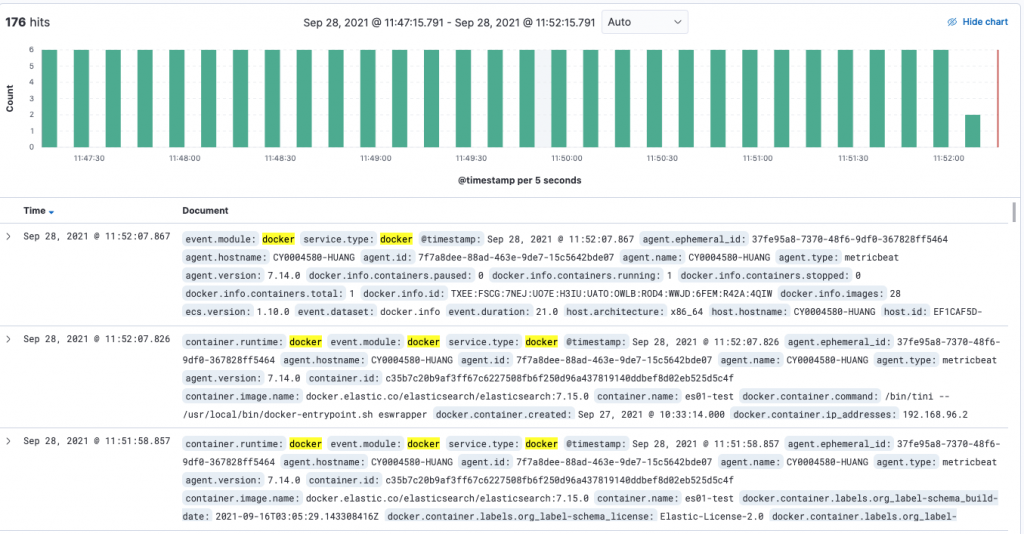
一、 kibana左選單 > Dashboard,可以看到在Dashboard內,多了一些建好的樣板,開啟相關樣板瀏覽資訊。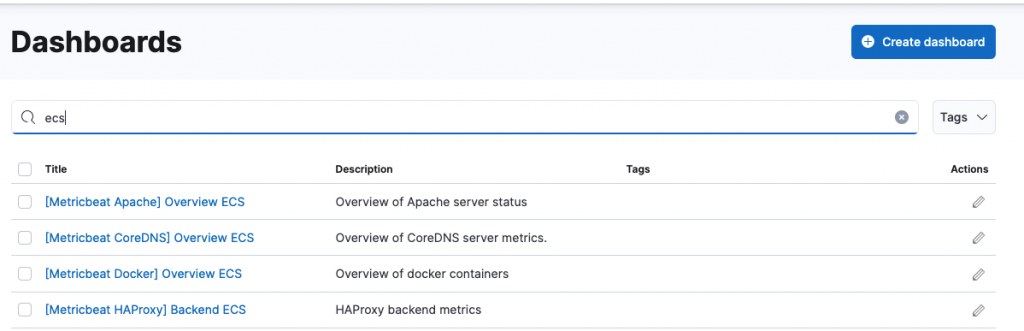
選擇你啟用的模組樣板([Metricbeat Docker] Overview ECS),就可以看到已經設定好的視覺化資料。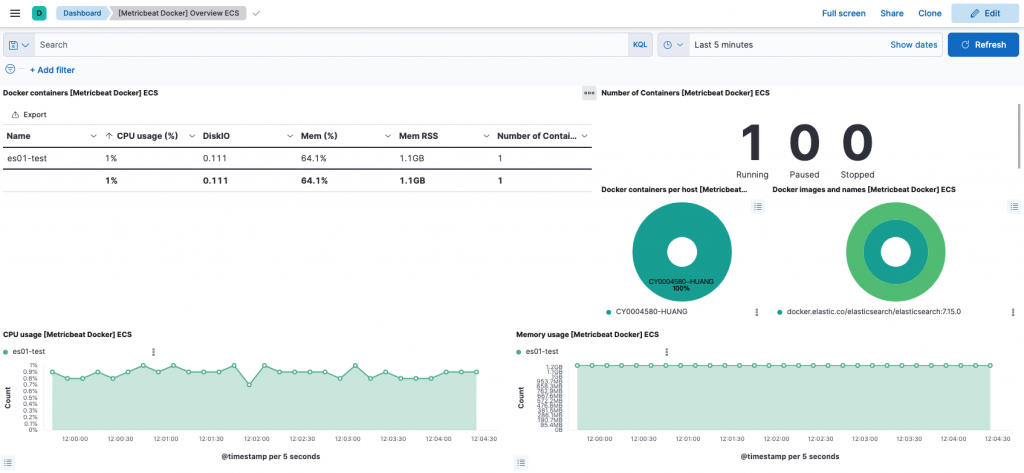
二、 kibana左選單 > Metrics,也可以看到一些指標資料。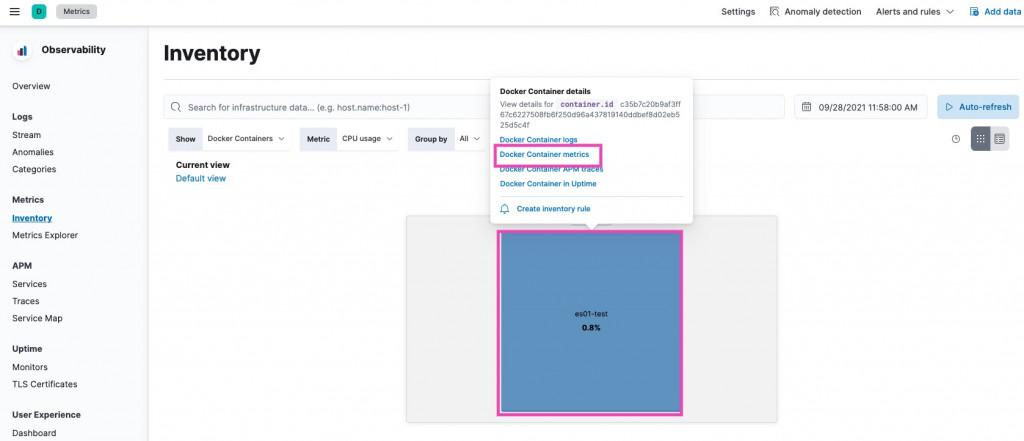
點選Docker Container metrics後可以看到更多的資料。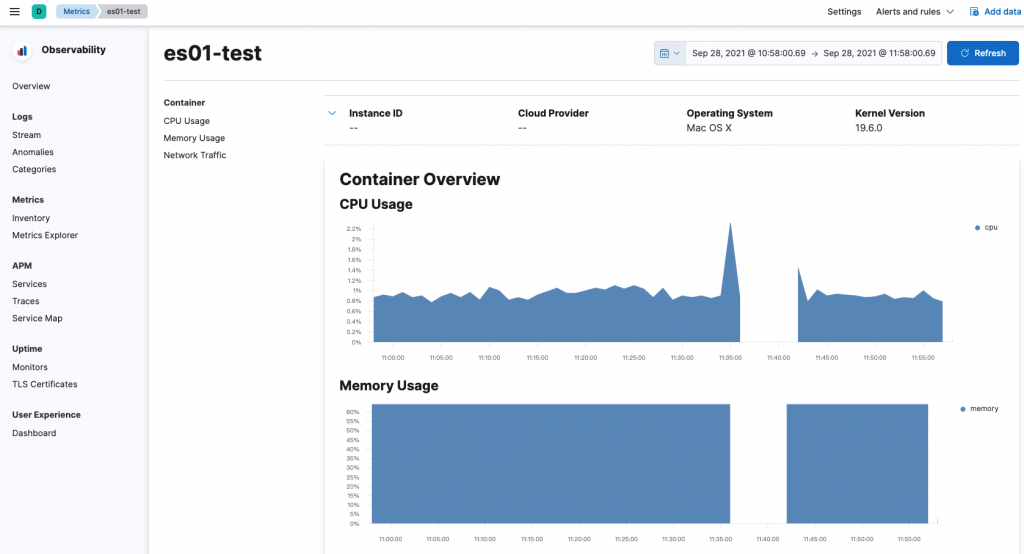
三、 選擇Metrics Explorer可以快速依照你的需求來畫出圖表。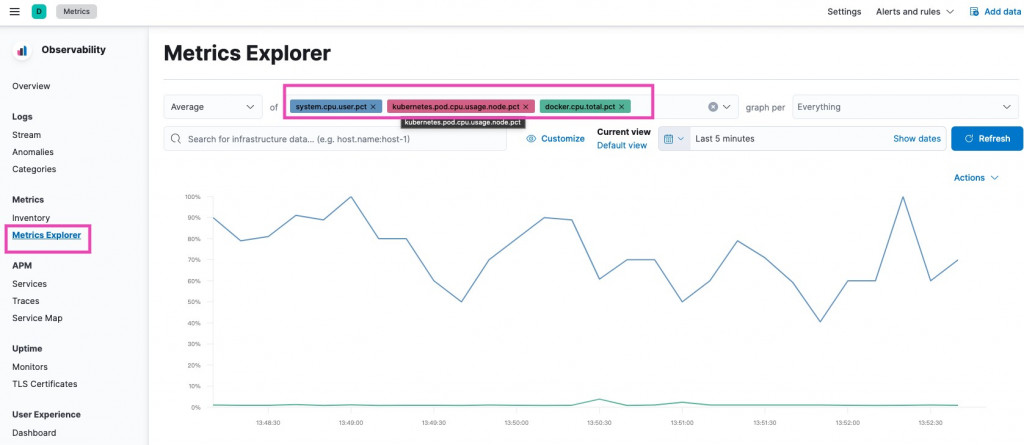
今日我們看到metricbeat在使用上,可以說是非常的簡單方便,不但容易監控機器,而且還提供內建圖形化的樣板,讓我們能輕鬆完成日常工作需要了。


 iThome鐵人賽