接續氣象站資料系列,如果我不想下載呢?
那就要用爬蟲囉~~
請先安裝
html5lib, lxml, beautifulsoup4, pandas
conda install -c conda-forge html5lib lxml beautifulsoup4 pandas
開始爬囉
主要利用氣象局提供的測站資訊,https://e-service.cwb.gov.tw/wdps/obs/state.htm
把這一個網頁的資訊作為基本資訊,然後寫了抓日及月的函式,分別為getdata_day及getdata_month
import requests
from bs4 import BeautifulSoup
import pandas as pd
from urllib.parse import quote
from datetime import datetime, timedelta
cwbstnweburl = "https://e-service.cwb.gov.tw/wdps/obs/state.htm"
cwbstn=requests.get(cwbstnweburl)
cwbstn.encoding = "utf-8"
tablecwbstn = BeautifulSoup(cwbstn.text,'lxml').find_all("table")
cwbstndf = pd.read_html(str(tablecwbstn), encoding = "utf-8",index_col=0)[0]


def getdata_day(stndf, stnumber, timemesag):
    header = ['ObsTime', 'StnPres', 'SeaPres', 'Temperature', 'Td dew point', \
          'RH', 'WS', 'WD', 'WSGust', 'WDGust', 'Precp', 'PrecpHour', 'SunShine', \
          'GloblRad', 'Visb', 'UVI', 'Cloud Amount']
    webmaster="https://e-service.cwb.gov.tw/HistoryDataQuery/DayDataController.do"
    webstn = "?command=viewMain&station={}".format(str(stnumber))
    stnchtname = stndf.loc[str(stnumber)]["站名"]
    stnaltitude = stndf.loc[str(stnumber)]["海拔高度(m)"]
    stnname = quote(stnchtname.encode("utf-8")).replace("%","%25")
    webputstnname = "&stname={}".format(stnname)
    webpickdate = "&datepicker={}".format(timemesag)
    webpickaltint = "&altitude={}m".format(int(stnaltitude))
    webpickaltfloat = "&altitude={}m".format(stnaltitude)
    weburl_a = webmaster + webstn + webputstnname + webpickdate + webpickaltint
    webur1_b = webmaster + webstn + webputstnname + webpickdate + webpickaltfloat
    #print(weburl)
    try:
        print(weburl_a)
        a = requests.get(weburl_a)
        table = BeautifulSoup(a.text,"lxml").find_all("table")
    except:
        print(weburl_b)
        a = requests.get(weburl_b)
        table = BeautifulSoup(a.text,"lxml").find_all("table")
    dftmp = pd.read_html(str(table))[1]
    dftmp.columns = header
    return dftmp

def getdata_month(stndf, stnumber, timemesag):
    header = ["ObsTime","StnPres","SeaPres","StnPresMax","StnPresMaxTime","StnPresMin","StnPresMinTime",
              "Temperature", "T Max", "T Max Time", "T Min", "T Min Time", "Td dew point", "RH", "RHMin",
             "RHMinTime","WS","WD","WSGust","WDGust","WGustTime","Precp","PrecpHour","PrecpMax10","PrecpMax10Time",
             "PrecpMax60","PrecpMax60Time","SunShine","SunShineRate","GlobRad","VisbMean","EvapA","UVI MAX",
             "UVI Max Time", "Cloud Amount"]
    webmaster="https://e-service.cwb.gov.tw/HistoryDataQuery/MonthDataController.do"
    webstn = "?command=viewMain&station={}".format(str(stnumber))
    stnchtname = stndf.loc[str(stnumber)]["站名"]
    stnaltitude = stndf.loc[str(stnumber)]["海拔高度(m)"]
    stnname = quote(stnchtname.encode("utf-8")).replace("%","%25")
    webputstnname = "&stname={}".format(stnname)
    webpickdate = "&datepicker={}".format(timemesag)
    webpickaltint = "&altitude={}m".format(int(stnaltitude))
    webpickaltfloat = "&altitude={}m".format(stnaltitude)
    weburl_a = webmaster + webstn + webputstnname + webpickdate + webpickaltint
    webur1_b = webmaster + webstn + webputstnname + webpickdate + webpickaltfloat
    #print(weburl)
    try:
        print(weburl_a)
        a = requests.get(weburl_a)
        table = BeautifulSoup(a.text,"lxml").find_all("table")
    except:
        print(weburl_b)
        a = requests.get(weburl_b)
        table = BeautifulSoup(a.text,"lxml").find_all("table")
    dftmp = pd.read_html(str(table))[1]
    dftmp.columns = header
    return dftmp

df = getdata_day(cwbstndf,"466920","2022-09-03")
print(df)
"""
for year in range(2000,2001):
    for mm in range(3,4):
        if mm < 10:
            initstr = str(year) + "-0" + str(mm)
        else:
            initstr = str(year) + "-" + str(mm)
        df = getdata_month(cwbstndf,"C0H9C0",initstr)
        print(df)
"""
執行完成上述的程式,就可以直接得到前兩天一樣的資料,劃出一樣的圖
大家可以把函式使用迴圈的方式執行,就可得到想要的日期等範圍,一勞永逸。
import matplotlib.pyplot as plt
ws = df["WS"]
tmp = df["Temperature"]
fig, ax = plt.subplots(figsize=(8,6))
p1 = ax.plot(range(1,25),ws,label="Wind speed")
ax.set_xticks(range(1,25))
ax.set_xlabel("Hour")
ax.set_ylabel("Wind speed (m/s)")
ax.set_title("Taipei 46692", loc="left")
ax.set_title("2022-09-03", loc="right")
#ax.legend()
ax2 = ax.twinx()
p2 = ax2.plot(range(1,25),tmp,"g-",label="Temperature")
ax2.set_ylabel("Temperature")
#plt.egend([ax.patch,ax2.patch],loc="upper left")
p = p1 +p2
labs = [l.get_label() for l in p]
ax.legend(p, labs, loc='upper left')
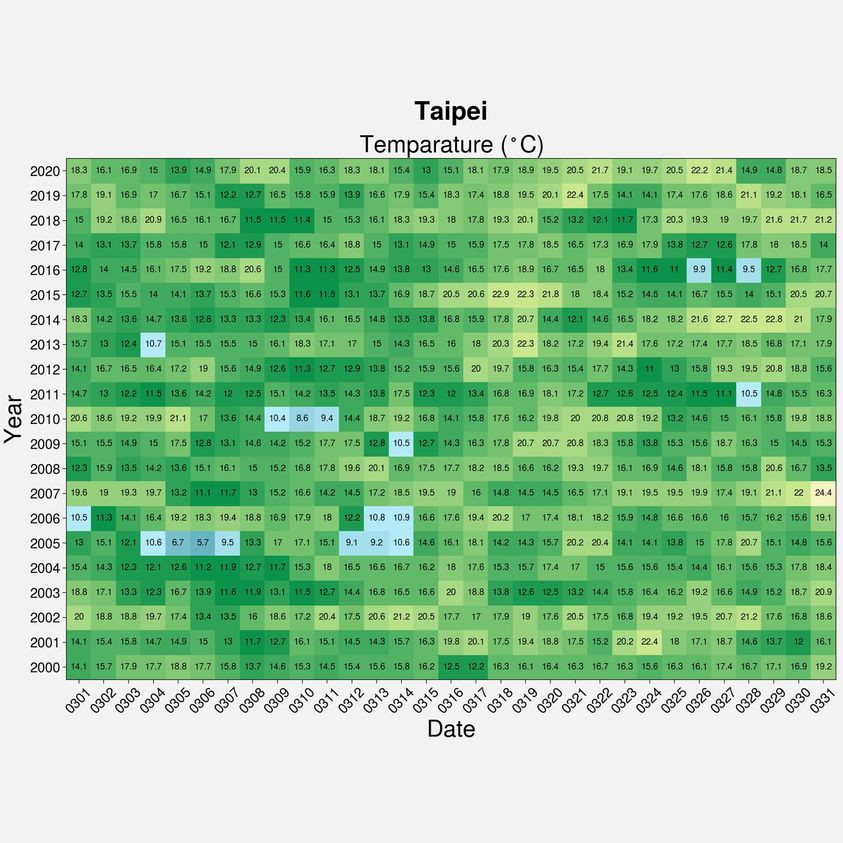
最後提供大家一張之前做的
3月份台北測站每天的觀測最低溫(以小時為準),只能抓到從2000年開始的歷史資料。最狂的應該是2005年3月份有攝氏5.7度。