視覺化:時間與距離之關係(scatter plot)
以座標觀察各租借站點位置(Google Data Studio)
查詢網路資源發現Python計算經緯度距離的函數---haversine
(Note:The Haversine (or great circle) distance is the angular distance between two points on the surface of a sphere.--sklearn)
身為一個不是很懂數學的人,只能大概嘗試認識一下函數的內容
Step.1 從資料庫讀取內容(不然每次都重跑其實蠻累的XD)
import pymysql
db1 = pymysql.connect(host = "127.0.0.1",
                      user = "root",
                      passwd = "12345678",
                      database = "bike_clean_data",
                      port = 3306)

cursor = db1.cursor()
cursor.execute('''SELECT * FROM clean_data
WHERE (ride_length >= '00:01:00')''')
data=cursor.fetchall()
L1=['index']
for i in range(len(L[0])):
    L1.append(L[0][i])

data=pd.DataFrame(data,columns=L1)
Step.2 使用haversine()計算騎乘距離,自訂義語法部分參考stackoverflow
from math import radians,cos,sin,asin,sqrt
def haversine(lon1,lat1,lon2,lat2): #開始經度/開始緯度/結束經度/結束緯度

    lon1,lat1,lon2,lat2=map(radians,[lon1,lat1,lon2,lat2])

    dlon=lon2-lon1
    dlat=lat2-lat1
    a=sin(dlat/2)**2+cos(lat1)*cos(lat2)*sin(dlon/2)**2
    c=2*asin(sqrt(a))
    r=6371

    return c*r*1000

haversine(float(data['start_lng'][0]),float(data['start_lat'][0]),
          float(data['end_lng'][0]),float(data['end_lat'][0]))
L2=[]
for i in range(len(data)):
    L2.append(haversine(float(data['start_lng'][i]),float(data['start_lat'][i]),
              float(data['end_lng'][i]),float(data['end_lat'][i])))
L3=[]
for i in L2:
    try:
        j=round(i,2) #取至小數點第二位
        L3.append(j)
    except:
        L3.append(i)
        pass

data.insert(16,column='distance',value=L3)
Step.3 製作散佈圖(x軸:距離;y軸:時間)
import pandas as pd
import seaborn as sns

# data[14]=data[14].astype('timedelta64')
# data['distance']=data['distance'].astype('float64')

ax = sns.scatterplot(x=data['distance'], y=data['ride_length'], hue=data['member_casual'])
ax.set_title('Scatter Chart')
結果出現TypeError錯誤訊息,說兩個的dtype型態不同無法作圖(果然跟時間扯上關係就會花我很久時間XDD)。順帶一提,dtype[timedelta64]是指兩個時間相減後的資料型態。
TypeError: The DTypes <class 'numpy.dtype[timedelta64]'> and <class 'numpy.dtype[float64]'> do not have a common DType. For example they cannot be stored in a single array unless the dtype is `object`.
於是我決定將timedelta64轉換成可計算的數值,參考stackoverflow成功將此欄轉換為小時(hours),並且是float64資料型態。
此處須注意:如果用datetime(dt)來轉換,只有days;seconds;mircoseconds的選項,所以我除以3600讓他變成是小時。
data['ride_length']=(data['ride_length'].dt.seconds)/3600

Out[20]:
0         23.946944
1         23.945833
2         23.931944
3         23.910278
4         23.907500

419210     0.016667
419211     0.016667
419212     0.016667
419213     0.016667
419214     0.016667
Name: ride_length, Length: 419215, dtype: float64
執行上方程式呈現散佈圖,但好像看不太出來一個規則就是了 ,因為原本假設是租借時間愈久、距離愈長。此外還有一點是distance的部分,有蠻多騎很久的使用者是同站租同站還,這部分就沒辦法估算騎乘距離,可能要再思考一下有沒有更好的表達方式。
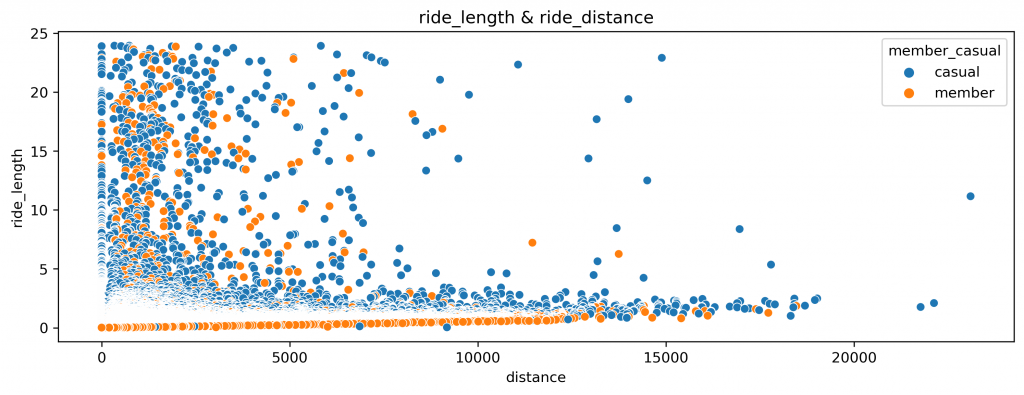
發文的現在已時候不早了...XD
明天再來進行比較有趣的部分,將原始csv檔案丟到GDS觀察,想使用原檔的經緯度等資訊來產出地理熱視圖,用以顯示租借次數多寡與位置的關係。
希望能成功!