昨天聊到了LogQL, 針對log內容與label查找的log query
今天來聊聊metric query.
Metric Queries基本上,
就是針對昨天聊到的log query的結果集合上進而創建Metric.
舉例: 針對錯誤的log的成長率, 時間內的數量或者top n的log.
也能針對log中的value做計算, 例如request size, 都可以用來被聚合或者生成新的一個data series.
LogQL借鑒了Prometheus的range vector的概念,
可以按照時間維度來對已經透過log queries篩選出來的log在進行聚合操作.
例如查到過去三小時內的log後, 在切割成每秒的單元進行統計.
這裡的每秒就是一個Time Durations的概念, 這跟Prometheus的Time Duration也是一樣.
有效的時間單元有
因為Prometheus和Loki存儲上都是Time-Series Database.
所有存儲的資料都在某個timestamp內的context中.
如果我們有一個序列, 能把一個timestamp印射到一個一個紀錄上, 那這就叫做timeseries
Prometheus中, 一組有相關的timeseries就叫做vector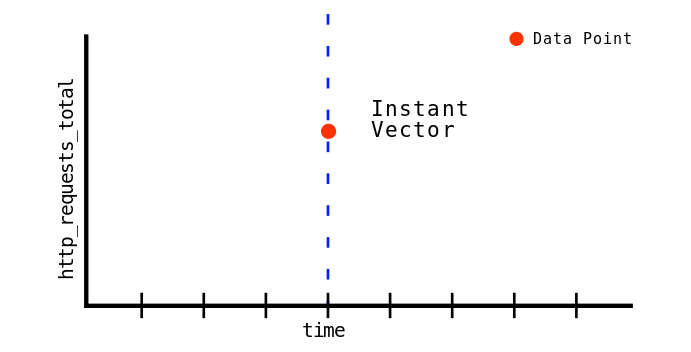
舉例 :
http_request_total是一個vector, 表示server收的http的request總數.
那我們就能夠搭配label來使用
// the set of timeseries representing the number of requests with a `200` HTTP response code.
http_requests_total{code="200"}

// the set of timeseries representing the number of requests served by the `/api/v1/query` handler.
http_requests_total{handler="/api/v1/query"}
http_request_total是指一組的timeseries, 只是剛好都被稱為http_request_total.
我們在搭配{code="200"}或者{handler="/api/v1/query"}, 選取其子集合.
就是一組timeseries, 每個timestamp映射到record的範圍, 使用自定義時間範圍查詢Prometheus/Loki, 那出來的結果也是一組vector, 聚合了所選時間區間內的所有值.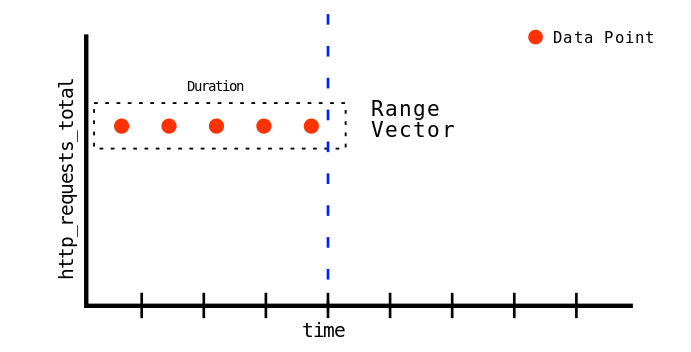
回頭繼續看LogQL
Range Vector aggregation支持兩種的Range Vector聚合操作
利用funtion在某個區間內做聚合, 時間區間能寫在昨天提到的log stream selector或者log pipeline的後面
像是
# 在log stream selector後面加上時間區間
count_over_time({job="mysql"}[5m])
# 在log pipeline後面加上時間區間
sum by (host) (rate({job="mysql"} |= "error" != "timeout" | json | duration > 10s [1m]))
LogQL提供的functions有
舉例:
# 計算MySQL這job, 最後五分鐘的log數量
count_over_time({job="mysql"}[5m])
# 每一分鐘為一個統計區間, 統計的對象是MySQL這job的log, 且內容要有error,  但內容不包含timeout, 實行執行大於10秒的每秒個數, 在用sum函數, 把所有host這label的值給加總起來
# 這裡就能顯示有幾台host出事情.
sum by (host) (rate({job="mysql"} |= "error" != "timeout" | json | duration > 10s [1m]))
Unwrapped ranges可以透過parser生成的label其value的值來做聚合
也就是說統計的對象不只是log本身的內容而已了.
格式比較明確, 長相一定是 | unwrap label_identifier
上述的label_identifier就是透過parser提取出來的label name
但我們是metrics, 總是要有數值的!
所以如果label的值是string類型的話, LogQL內建兩個function來幫忙轉換成float64bits數值類型.
提供的unwrapped ranges function很多
能自個來官方網站查詢連結
舉例說明
計算ingress-nginx容器的每個path, 計算p99延遲
quantile_over_time(0.99,
  {cluster="ops-tools1",container="ingress-nginx"}
    | json
    | __error__ = ""
    | unwrap request_time [1m]) by (path)
讀的懂上面的話就能來玩看看Grafana Demo這網站內的範例連結
Log最早長這樣, 語法內有些Grfana dashboard變數, 就上面下拉選單選到的對象
透過昨天提到的json parser expression 來轉換格式, 並提取label
可以看到有些log, 畫面上會出現三角形icon
這是function套用失敗後, LogQL會把錯誤訊息新增一個名為**error**的label上, 並且把錯誤訊息放在value內.
來看轉換成功的, 則是提取出一堆label
快轉:) 直接看結果
我想要查看p95每個主機機的請求延遲時間
quantile_over_time(0.95,{$label_name=~"$label_value", job=~"$job", instance=~"$instance"} | json | unwrap request_time | __error__="" [$__interval]) by (host)

這裡就用了unwrap 指定request_time這label_identifier.$__interval這是Grafana的global variable, 跟右上角選的時間區間是連動的, 我畫面選最近一小時
$__interval說明連結
除了前面介紹的
LogQL也像PromQL一樣提供了內建的aggregation operators連結在此
在aggregation的基礎上, 在進行新的聚合操作, 可以把log內容統計後聚合顯示在dashboard上.
語法格式如下
<aggr-op>([parameter,] <vector expression>) [without|by (<label list>)]
舉例
每5分鐘為一個時間區間來統計{region="us-east1"}下的log, 每秒log出現最多次的前10條, 並且秀出它的name這label的值
topk(10,sum(rate({region="us-east1"}[5m])) by (name))
列舉出{job="mysql"})過去5分鐘的log數量, 並且以level作為維度來進行統計, 秀出各level的數量
sum(count_over_time({job="mysql"}[5m])) by (level)
一樣來Grafana Demo看看
這裡有分國家清單(還有國旗真炫)

每5分鐘為一個時間區間來統計{region="us-east1"}下的log, 每秒log出現最多次的前10條, 並且秀出它的name這label的值
topk(10, sum by (geoip_country_code) (count_over_time({$label_name=~"$label_value", job=~"$job", instance=~"$instance"} | json | geoip_country_code != "" and __error__="" [$__interval])))
很長我知道!
我們先拆解
以時間區隔為一個區間來計算{$label_name=~"$label_value", job=~"$job", instance=~"$instance"} | json | geoip_country_code != "" and __error__=""下的log的數量, 並且以geoip_country_code作為維度來進行統計, 秀出各level的數量
sum by (geoip_country_code) (count_over_time({$label_name=~"$label_value", job=~"$job", instance=~"$instance"} | json | geoip_country_code != "" and __error__="" [$__interval]))
再來就回到原始的expression, 取topk 10而已, 當然這時也只有geoip_country_code了
Understanding Prometheus Range Vectors
不是很懂這領域的東西...所以只好給你打氣加油XD,就快完賽囉
我也不懂XD
是下班時間自修的, 現任公司也沒得請教跟用到很深
雷恩大 今天壓線!!!
LogQL是局限於特定的產品或平台才可以使用嗎 (例如gcp / aws等)
LogQL,這查詢語言只能對Loki,
若是其他平台的存儲(aws cloudwatch, gcp monitor...)
Grafana 有支援的datasource能串接, 但舊不能用LogQL查詢(畢竟這存儲不是Loki)
若是要再把cloudwatch的資料透過別的agent寫到Loki也是沒意義.
真的需要就是能在AWS上起個fluentbit/otel collector, 把log直接從app打到agent上, 寫到loki做存儲.