今天先來聊怎麼讓Grafana的Log與Trace能互通有無的顯示
在Day7 淺談OpenTelemetry Specification - Logs
最後我有放一張圖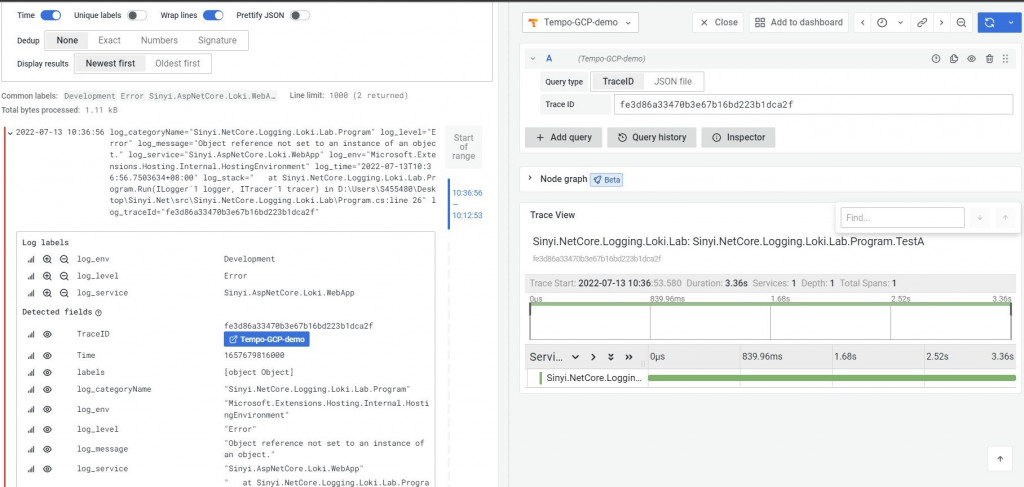
今天來展示怎麼弄出這效果的.
會需要透過一個遙測資料資料產生器Synthetic Load Generator
這個部份明天會更詳細的介紹它.
docker plugin install grafana/loki-docker-driver:latest --alias loki --grant-all-permissions
確認plugin是否存在
docker plugin ls

上圖是docker loki plugin有被安裝且啟用的顯示
會需要這個是因為我希望Synthetic Load Generator該容器的log, 能直接寫到Loki中.
但這服務本身沒辦法改它的log輸出方法, 我就透過docker的logging driver, 來寫到Loki.
docker plugin install grafana/loki-docker-driver:latest --alias loki --grant-all-permissions
確認plugin是否存在
docker plugin ls
上圖是docker loki plugin有被安裝且啟用的顯示
今天要展示的東西有點多, Tempo之前沒介紹到,
但它是一款Grafana Labs紀錄以及顯示Trace的服務, 跟Jaeger相等.
也能吃Jaeger的protocol.
關於Jaeger能參閱我前年的文章
分布式追蹤服務 Jaeger 簡介與安裝
Jaeger續, DAG套件與更多案例
Tempo的部份我之後慢慢介紹
/
  docker-compose.yaml
  grafana/
      grafana-datasources.yaml
  synthetic-load-generator/
      load-generator.json
  tempo/
      tempo-local.yaml
  tempo-data/
  .env
docker-compose.yaml
version: "3"
services:
  loki:
    image: grafana/loki:latest
    command: [ "-config.file=/etc/loki/local-config.yaml" ]
    ports:
      - "3100:3100"                                   # loki needs to be exposed so it receives logs
    environment:
      - JAEGER_AGENT_HOST=tempo
      - JAEGER_ENDPOINT=http://tempo:14268/api/traces # send traces to Tempo
      - JAEGER_SAMPLER_TYPE=const
      - JAEGER_SAMPLER_PARAM=1

  tempo:
    image: grafana/tempo:latest
    command: [ "-config.file=/etc/tempo.yaml" ]
    volumes:
      - ./tempo/tempo-local.yaml:/etc/tempo.yaml
      - ./tempo-data:/tmp/tempo
    ports:
      - "14268:14268"  # jaeger ingest
      - "3200:3200"   # tempo
      - "4317:4317"  # otlp grpc
      - "4318:4318"  # otlp http
      - "9411:9411"   # zipkin
    depends_on:
      - loki
    logging:
      driver: loki
      options:
        loki-url: 'http://localhost:3100/loki/api/v1/push'

  synthetic-load-generator:
    image: omnition/synthetic-load-generator:1.0.29
    volumes:
      - ./synthetic-load-generator/load-generator.json:/etc/load-generator.json
    environment:
      - TOPOLOGY_FILE=/etc/load-generator.json
      - JAEGER_COLLECTOR_URL=http://tempo:14268
    depends_on:
      - tempo
    logging:
      driver: loki
      options:
        loki-url: 'http://localhost:3100/loki/api/v1/push'

  grafana:
    image: grafana/grafana:latest
    volumes:
      - ./grafana/grafana-datasources.yaml:/etc/grafana/provisioning/datasources/datasources.yaml
    environment:
      - GF_AUTH_ANONYMOUS_ENABLED=true
      - GF_AUTH_ANONYMOUS_ORG_ROLE=Admin
      - GF_AUTH_DISABLE_LOGIN_FORM=true
    ports:
      - "3000:3000"
grafana-datasources.yaml
apiVersion: 1

datasources:
- name: Loki
  type: loki
  url: http://loki:3100
  isDefault: true
  uid: loki
- name: Tempo
  type: tempo
  # Access mode - proxy (server in the UI) or direct (browser in the UI).
  access: proxy
  url: http://tempo:3200
  jsonData:
    httpMethod: GET
    tracesToLogs:
      datasourceUid: 'loki'
      tags: ['job', 'instance', 'pod', 'namespace']
      mappedTags: [{ key: 'service.name', value: 'service' }]
      mapTagNamesEnabled: false
      spanStartTimeShift: '1h'
      spanEndTimeShift: '1h'
      filterByTraceID: false
      filterBySpanID: false
    search:
      hide: false
    nodeGraph:
      enabled: true
    lokiSearch:
      datasourceUid: 'loki'
load-generator.json
太長了所以直接給Github連結
這部份的說明, 我明天再來補充, 很好玩:)
tempo-local.yaml
metrics_generator_enabled: true

server:
  http_listen_port: 3200

distributor:
  receivers:                           # this configuration will listen on all ports and protocols that tempo is capable of.
    jaeger:                            # the receives all come from the OpenTelemetry collector.  more configuration information can
      protocols:                       # be found there: https://github.com/open-telemetry/opentelemetry-collector/tree/main/receiver
        thrift_http:                   #
        grpc:                          # for a production deployment you should only enable the receivers you need!
        thrift_binary:
        thrift_compact:
    zipkin:
    otlp:
      protocols:
        http:
        grpc:
    opencensus:

ingester:
  trace_idle_period: 10s               # the length of time after a trace has not received spans to consider it complete and flush it
  max_block_bytes: 1_000_000           # cut the head block when it hits this size or ...
  max_block_duration: 5m               #   this much time passes

compactor:
  compaction:
    compaction_window: 1h              # blocks in this time window will be compacted together
    max_block_bytes: 100_000_000       # maximum size of compacted blocks
    block_retention: 1h
    compacted_block_retention: 10m

metrics_generator:
  registry:
    external_labels:
      source: tempo
      cluster: docker-compose
  storage:
    path: /tmp/tempo/generator/wal
    remote_write:
      - url: http://prometheus:9090/api/v1/write
        send_exemplars: true

storage:
  trace:
    backend: local                     # backend configuration to use
    block:
      bloom_filter_false_positive: .05 # bloom filter false positive rate.  lower values create larger filters but fewer false positives
      index_downsample_bytes: 1000     # number of bytes per index record
      encoding: zstd                   # block encoding/compression.  options: none, gzip, lz4-64k, lz4-256k, lz4-1M, lz4, snappy, zstd, s2
    wal:
      path: /tmp/tempo/wal             # where to store the the wal locally
      encoding: snappy                 # wal encoding/compression.  options: none, gzip, lz4-64k, lz4-256k, lz4-1M, lz4, snappy, zstd, s2
    local:
      path: /tmp/tempo/blocks
    pool:
      max_workers: 100                 # worker pool determines the number of parallel requests to the object store backend
      queue_depth: 10000

overrides:
  metrics_generator_processors: [service-graphs, span-metrics]
.env
#.env
COMPOSE_HTTP_TIMEOUT=200
執行bash docker-compose up -d
在瀏覽器打開localhost:3000
確認DataSources有以下的資料來源配置
接著我們先進到Explore選擇Loki
{compose_service="synthetic-load-generator"}
隨便選一個log, 展開其內容
找到message那field, 其內容有traceId, 把值複製起來
我這圖上就是aba0a5c9b1bf5a02
接著上面有個Split切割視窗, 點下去後source選擇Tempo
貼上剛剛複製的值在TraceID底下按查詢
左邊是Log, 右邊則是Tempo Trace. 能看到各服務節點之間的鏈路圖
上圖則是各Span之間所夾帶的Span Tags(任何你想夾帶的資料, 但請別放密碼拜託!!!), 一目了然.

Tempo有支援Node Graph的DAG圖像化功能
能直接顯示各節點的名稱以及時間成本, 和總時長的佔比.
顏色越綠的佔比越低, 表示可能很快?
顏色越黃, 或者越紅表示佔比越高.

官方對於顏色的說明如下
The color of each circle represents the percentage of requests in each of the following states:
green = success
red = fault
yellow = errors
purple = throttled responses
(我們在MySQL也很常看explain找兇手, 這裡也是方便看到)
現在手動的複製traceID到tempo看來環境可行了!
那有沒有辦法能讓log直接快速的能連結到對應traceID的tempo呢?
答案是OK
主要用到的設定是DataSource Loki的Derived fields
它有兩種功能
因此我們就能想想看,
要是我能拿到剛剛複製的traceID, 自動地帶入到Tempo的查詢上, 不用完成了?
以下兩張圖片是官方的範例!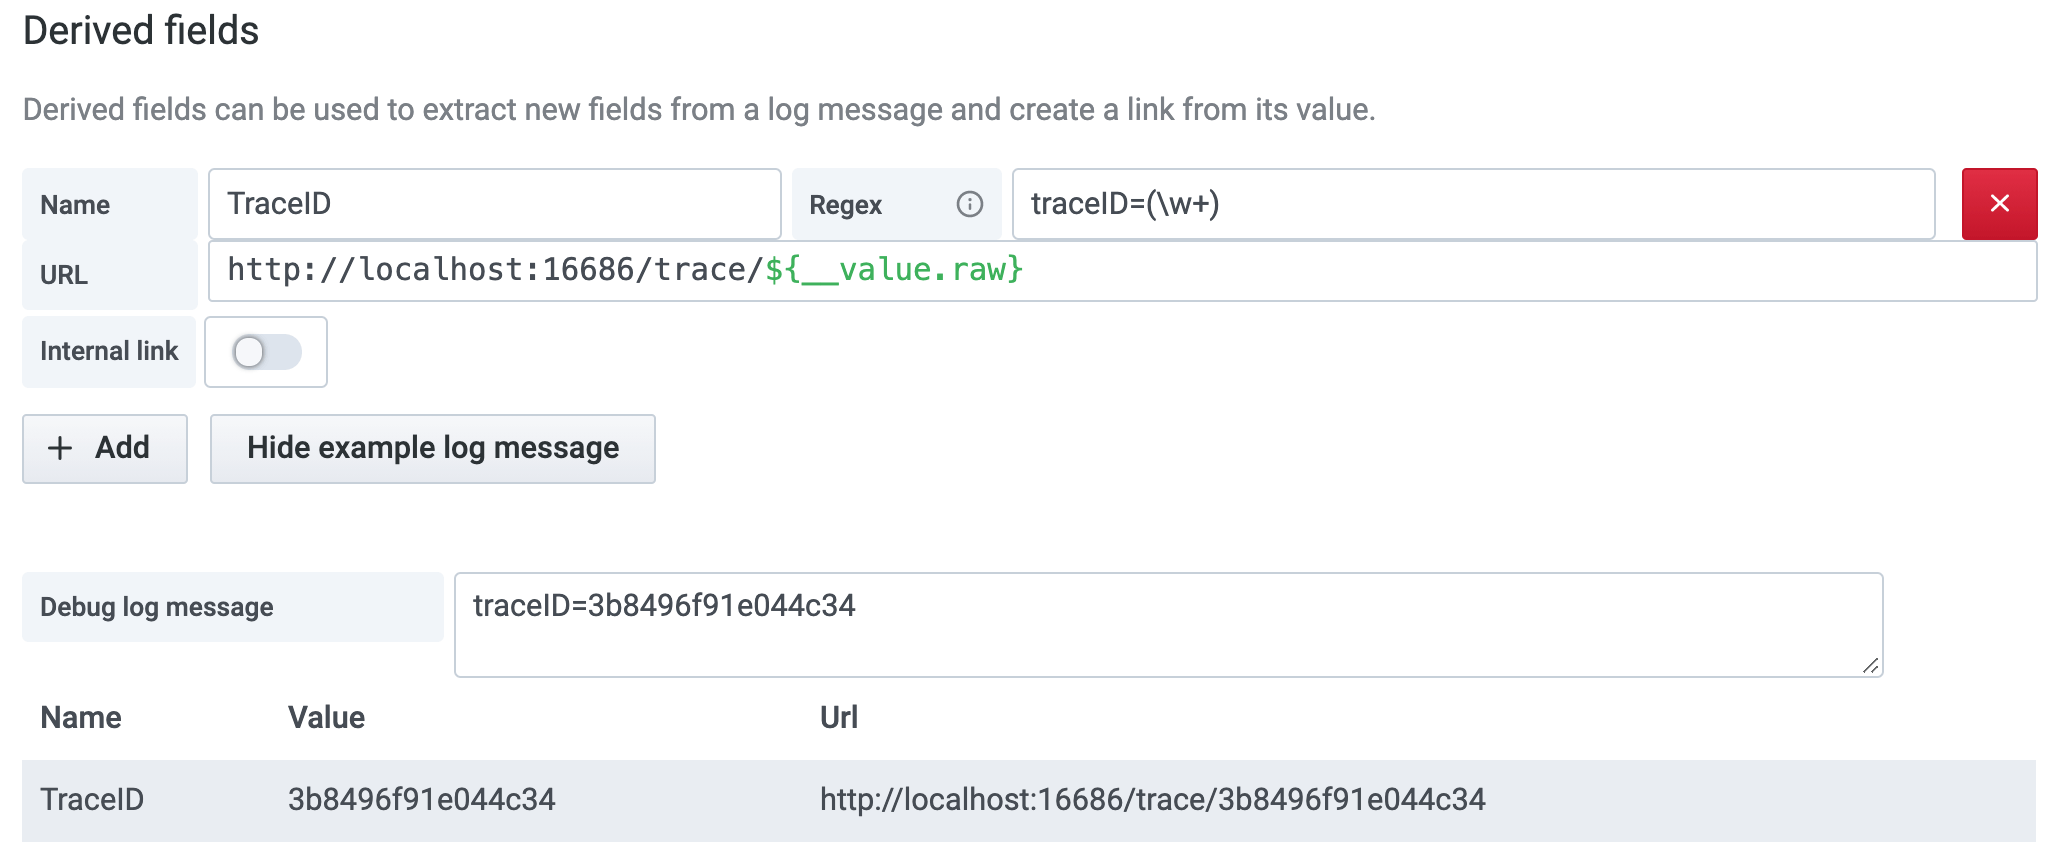
我們就根據這裡, 把剛剛的grafana-datasources.yaml給修改一下
改的方向有
grafana-datasources.yaml
apiVersion: 1

datasources:
- name: Loki
  type: loki
  url: http://loki:3100
  isDefault: true
  uid: loki
  jsonData:
     maxLines: 1000
     derivedFields:
      # Field with external link.
      - datasourceUid: tempo
        matcherRegex: "(?:traceId) (\\w+)"
        name: TraceID
        url: '$${__value.raw}'
- name: Tempo
  type: tempo
  # Access mode - proxy (server in the UI) or direct (browser in the UI).
  access: proxy
  url: http://tempo:3200
  uid: tempo
  jsonData:
    httpMethod: GET
    tracesToLogs:
      datasourceUid: 'loki'
    search:
      hide: false
    nodeGraph:
      enabled: true
    lokiSearch:
      datasourceUid: 'loki'
更改完畢後, 容器重新來過
再來Datasources, Loki的配置畫面應該就變成有以下的配置
Regex的部份就不說明了, 不太難懂.${__value.raw}這是在Query用的, 它其實是個樣本模板, 會把Regex的結果代入.
Internal Link則是連結到Tempo, 這就是為什麼要都給一個uid的緣故, 要在yaml內配置連結都需要一個唯一的名稱來查找.
DataLinkBuiltInVars variable
參考的程式碼
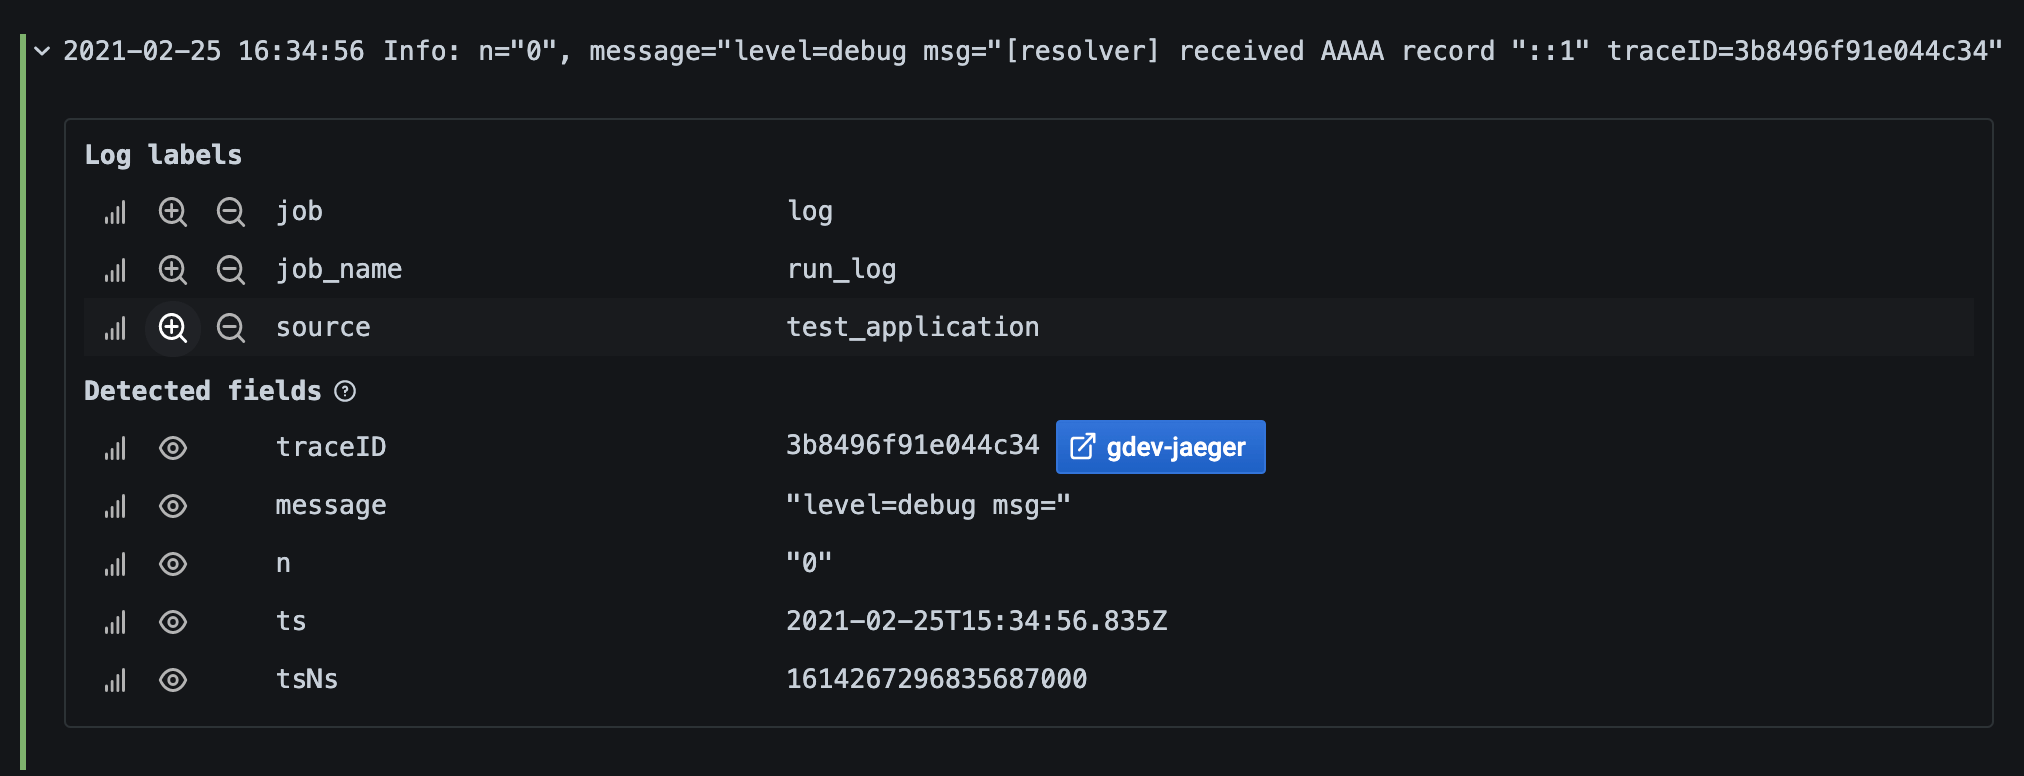
現在來到Explore, 選擇Loki, 任選一個log
應該會出現類似下面的樣貌, 多一個field叫做TraceID, 旁邊還有藍色小按鈕
點下去之後就這樣

該配置設定好後就能在Tempo畫面上去搜尋Loki的log
然後就能在Explore tempo這裡使用Search, 如同在Loki那樣操作
也能用LogQL快速找到對應的Log後, 來顯示其Trace
Grafana在Loki與Tempo這兩個自家的產品上整合度相當的高
Tempo的NodeGraph說很潮
幾乎能取代Jaeger的DAG功能, 讓我們對於微服務底下的請求鏈路更加清晰.
中華一番第19集, 愛的千鶴橋, 能回味:)