seaborn
seaborn為python繪圖函式庫
以matplotlib為基礎,是Matplotlib的進階版,可以更加快速,語法更簡潔的繪製出圖形
接下來用seaborn內建資料庫做示範
import matplotlib
matplotlib.use('TkAgg')#
import seaborn as sns
import matplotlib.pyplot as plt
import pandas as pd

taxis = sns.load_dataset("taxis")
taxis['dropoff'] = pd.to_datetime(taxis['dropoff'], errors='coerce')
taxis['pickup'] = pd.to_datetime(taxis['pickup'], errors='coerce')
taxis['handling_time'] = (taxis['dropoff'] - taxis['pickup']).dt.total_seconds()
print(taxis['handling_time'])
sns.relplot(x="handling_time", y="distance",hue="total", data=taxis)
plt.show()
Output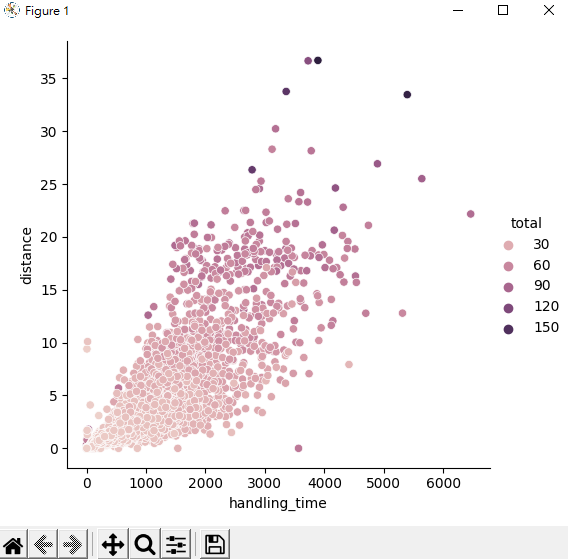


 iThome鐵人賽