圓餅圖
接下來介紹用pie()來繪製圓餅圖
import pandas as pd
import matplotlib.pyplot as plt
df = pd.DataFrame([
    ['China', 1450000000],
    ['India', 1400000000],
    ['Indonesia', 278462000],
    ['Pakistan', 229785000],
    ['Bangladesh', 171200000],
    ['Russia', 145031000],
    ['Japan', 124891000],
    ['Philippines', 115699395],
    ['Vietnam', 99100000],
    [' Iran', 88000000],
    ['Turkey', 85214000],
    ['Thailand', 70100000]],
    columns=['country', 'pop'])
plt.pie(df['pop'], labels=df['country'], autopct='%1.2f%%')
#autopct是指區塊裡面的百分比的格式
plt.title('Population')
plt.show()
ouput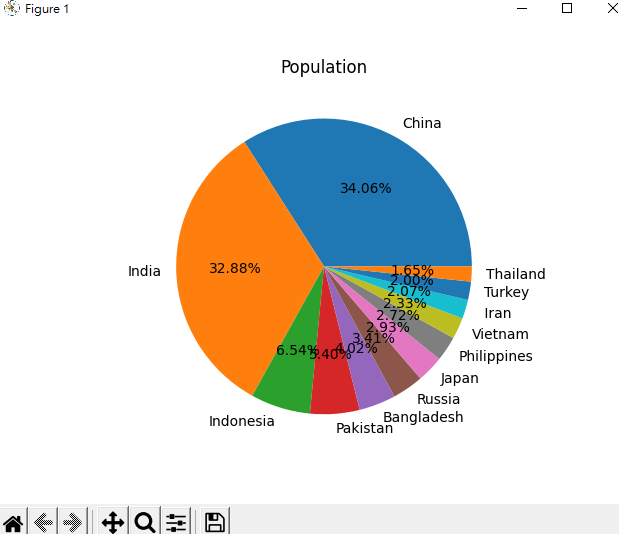
想單獨拉一塊來看
exp = [0] * len(df)
exp[6] = 0.5
plt.pie(df['pop'], labels=df['country'], autopct='%1.2f%%', explode=exp)
plt.title('Population')
plt.show()
output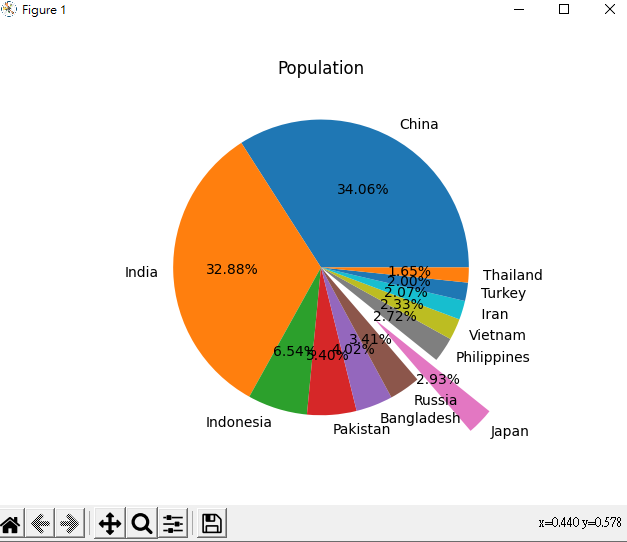


 iThome鐵人賽