Matplotllib是Python的視覺化套件,可將資料視覺化。
接下繪圖
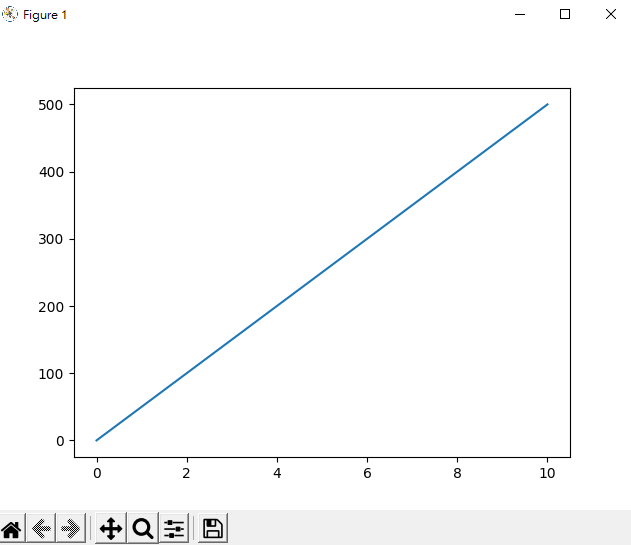
折線
import matplotlib.pyplot as plt
import numpy as np
x = np.array([0, 10]) #x軸
y = np.array([0, 500])#y軸
plt.plot(x, y)
plt.show()

plot( )用於繪製圖上的點
(x, y)參數等同x,y軸上點的陣列
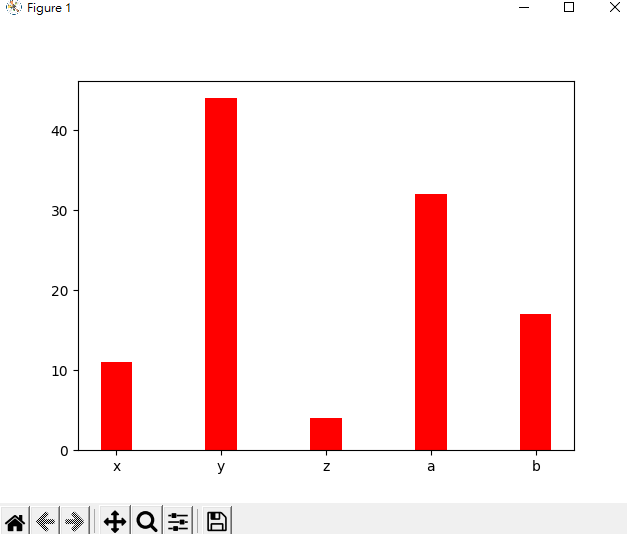
直方圖
import matplotlib.pyplot as plt
x_axis = ['x', 'y', 'z', 'a', 'b']
y_axis = [11, 44 ,4 ,32,17]
plt.bar(x_axis, # X資料
        y_axis, # Y資料
        0.3, # bar寬度
        color='red' # bar顏色
        )
plt.show()

