過去我們談了許多以 Regression 來解監督式學習的問題,今天我們來看看另一種方向, Support Vector Machine (SVM) 。
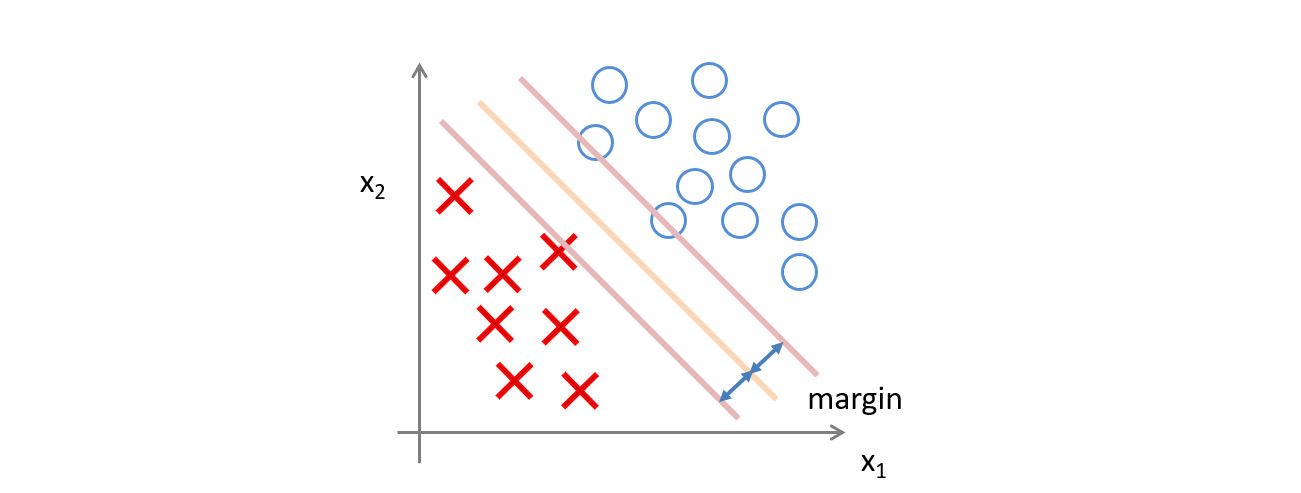
SVM 跟過去的 Classification 很類似,都是希望找到一條線或是一個平面去切開成兩個區域,藉此分類兩個類別。不過 SVM 可以做到一些非線性的切割,並且會嘗試找到一個線或是平面能夠將兩個類別以最大的間距隔開。
此外,SVM 與 Logistic Regression 相較下比較能避免 Outlier,也就是一些雜訊影響。
修改自 Andrew Ng 於 2014 年 Machine Learning 課程簡報
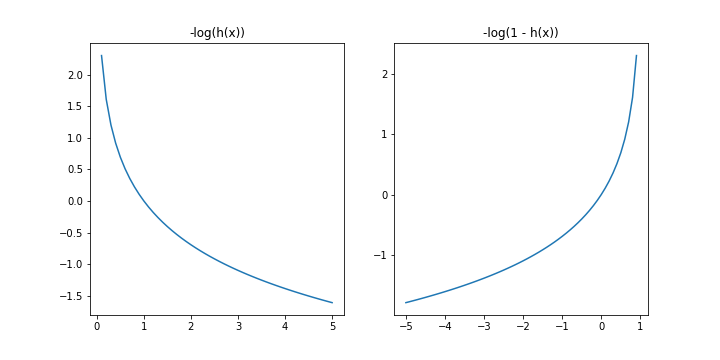
過去我們在 Logistic Regression 定義的單一 Loss Function 是這樣的。

表示機器的模型,
%20%3D%20%5Cfrac%7B1%7D%7B1%20%2B%20e%5E%7B-%5Ctheta%5ETx%7D%7D)
表示輸入參數
表示模型參數
當時我們之所以這樣設計是因為
因此當 ,則
越大越好。反之則希望越小越好。
當時也畫了這兩張圖來對照在不同狀況下我們會希望更新朝向哪個方向前進。
SVM 不希望只是這樣,應該要更加嚴格,讓找到的這一條線能夠使兩個類別 有最大的間距 。
細節上來說,它是將單一的 Loss Function 修改如下。

其中

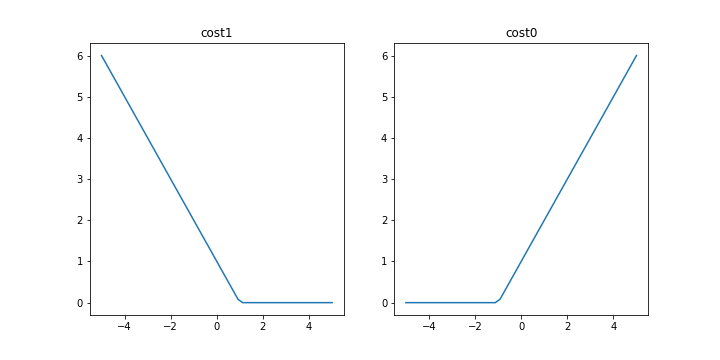
斜線的斜率你可以自己調整,這邊預設斜率都是 1 的狀況
所以當答案要是 True 時,即便現在給定的輸出已經大於 0 了,如果還沒到 1 的話你會看到 Loss 還是存在的,不會是 0。
反之當答案要是 False 時,即便現在給定的輸出已經小於 0 了,如果還沒到 -1 的話你會看到 Loss 也是存在的,不會是 0。
這樣的作法使得 Large Margin 存在,也讓 SVM 能夠有很不錯的分類。
剛剛談的是單一 Loss,當然跟 Logistic Regression 相同,我們會需要有整體的 Loss。

與過去 Logistic Regression 對照一下

差異在於後續單一的 Loss 以及前面的常數。
最後再加上 Regularization Term。

如果你好奇為什麼 Regularization 的參數
怎麼消失了,你可以想成我們把式子乘上了
,而首項的
與之相乘後變成了
。
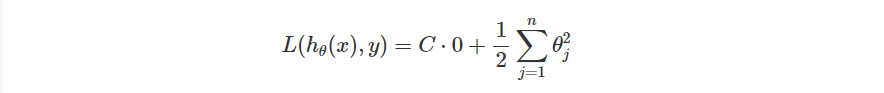
最後,SVM 說當 很大的時候,我們要選的
需要使得整個式子趨近於 0 ,才能使 Loss 降低,也就是 Loss Function 會變成

這條式子會使得 SVM 盡可能使間距越大越好。
修改自 Andrew Ng 於 2014 年 Machine Learning 課程簡報
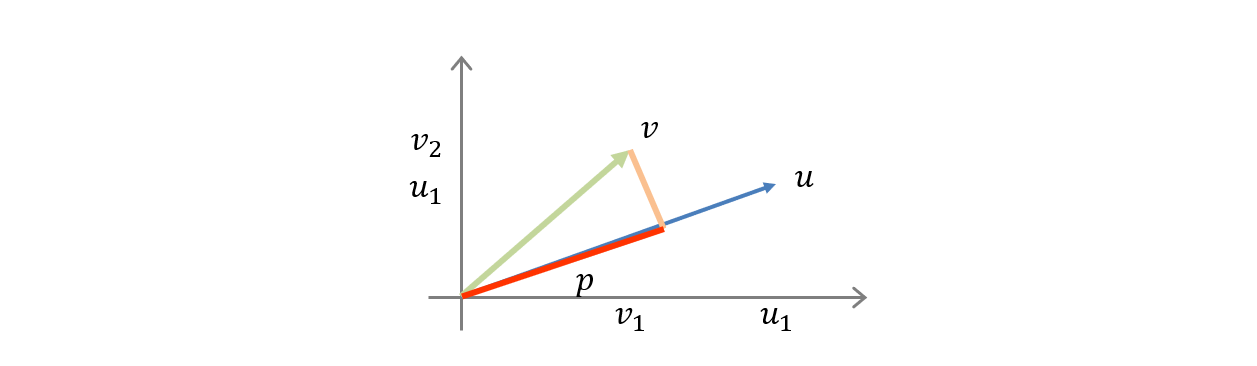
如果我有兩個向量 ,那麼
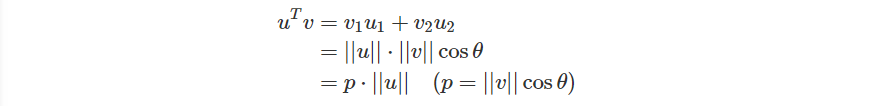
是從
投影至
的向量
是向量
是向量
之間的夾角
並且如果 時,
。
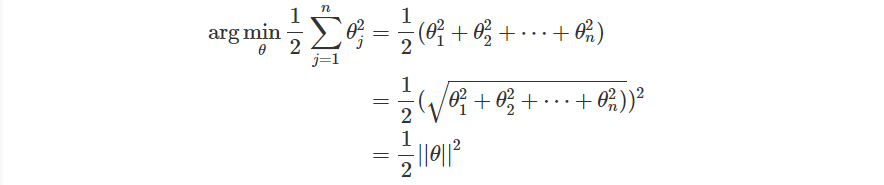
方才我們提及當 很大的時候,Loss Function 會變成
也就是說,我們要最小化的目標變成了
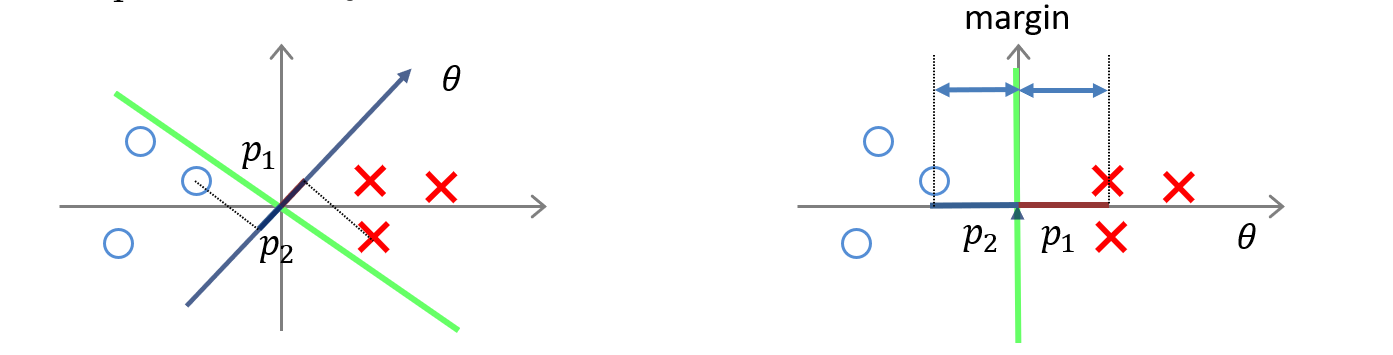
把參數與輸入相乘,也把前面項量的概念引進來

也就是上面投影出來的向量
前面我們說
現在將內容替換就會變成
在目標是希望使 最小化的情況下,要符合這樣的條件,也只能是希望
越大越好,也就造成了 Margin 越大越好的狀況了。
修改自 Andrew Ng 於 2014 年 Machine Learning 課程簡報
今天我們先簡單介紹了 SVM 是什麼,以及它是如何達到 Large Margin 的目標,明天我們會繼續介紹 SVM 是如何製作出非線性的 boundary!


 iThome鐵人賽