iT邦幫忙

2023 iThome 鐵人賽

DAY 26
0
Mobile Development

React Native CLI 開發心法系列 第 26

DAY 26 React Native 效能優化:使用 Firebase Performance Monitoring 監控應用程式效能

  • 分享至 

  • xImage
  •  

利用 firebase 打造自動監測應用程式效能的工具,當效能發生問題時就會系統自動發信通知,最重要的是可以同時監測到 iOS 跟 Android 的正式環境的效能問題!

Performance Monitoring

https://ithelp.ithome.com.tw/upload/images/20231001/2016249648WVKnGkZd.png

功能

  • 效能監控:可以透過 Performance Monitoring 監控應用程式的效能,透過 firebase 可以查看即時的效能指標。
  • 自定義的效能指標:你可以自己定義效能指標,以追蹤使用者特定的操作或事件。
  • 效能報告與分析:firebase 提供了效能的趨勢圖、統計數據,有助於你深入追蹤應用程式的效能問題。
  • 即時效能監測:當效能指標低於訂定的標準,就會及時通知你,讓你能在第一時間處理效能的問題。

安裝

在專案中安裝 Performance Monitoring


yarn add @react-native-firebase/app

yarn add @react-native-firebase/perf

cd ios/ && pod install

設定 Android

/android/build.gradle 中加入:

buildscript {
    dependencies {
        // ...
        classpath 'com.google.firebase:perf-plugin:1.4.2' //新增
    }

/android/app/build.gradle 上方加入:

apply plugin: "com.android.application"
apply plugin: 'com.google.gms.google-services'
apply plugin: 'com.google.firebase.appdistribution'
apply plugin: 'com.google.firebase.crashlytics'
apply plugin: 'com.google.firebase.firebase-perf' //新增

重新打包並安裝 Andriod 跟 iOS 應用程式

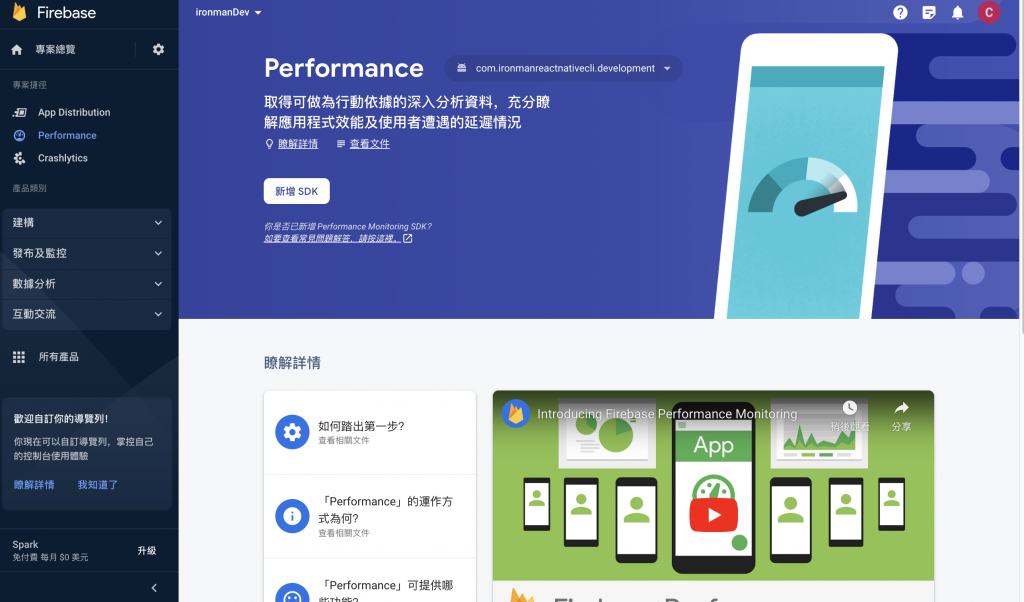
這時候安裝新 build 的應用程式就可以在 firebase 後台收到相關的數據了。
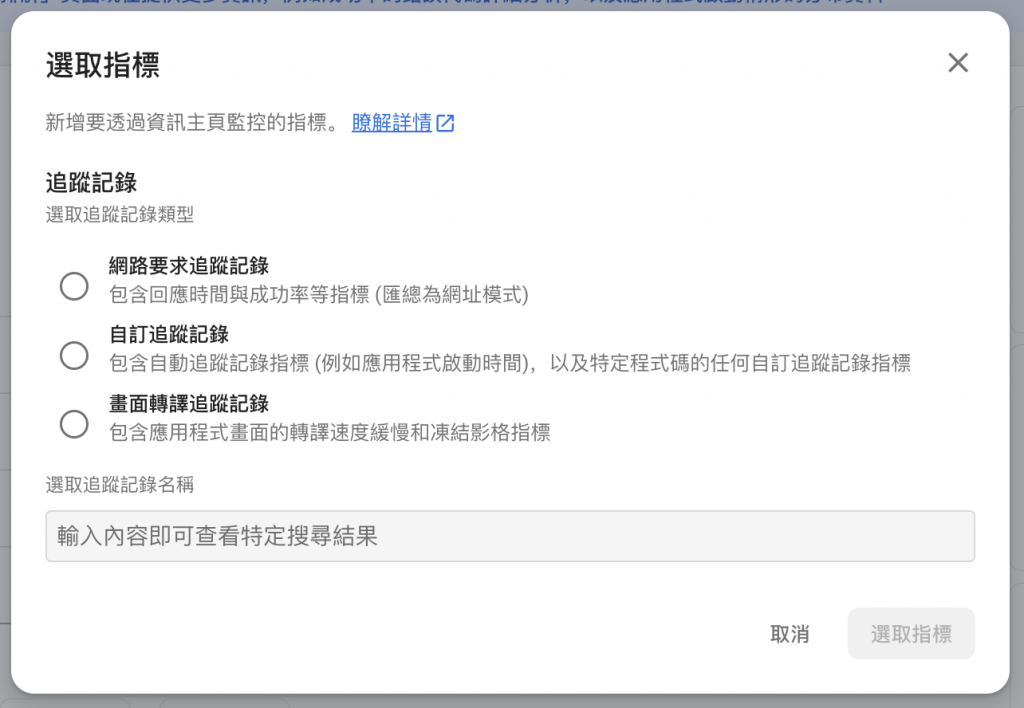
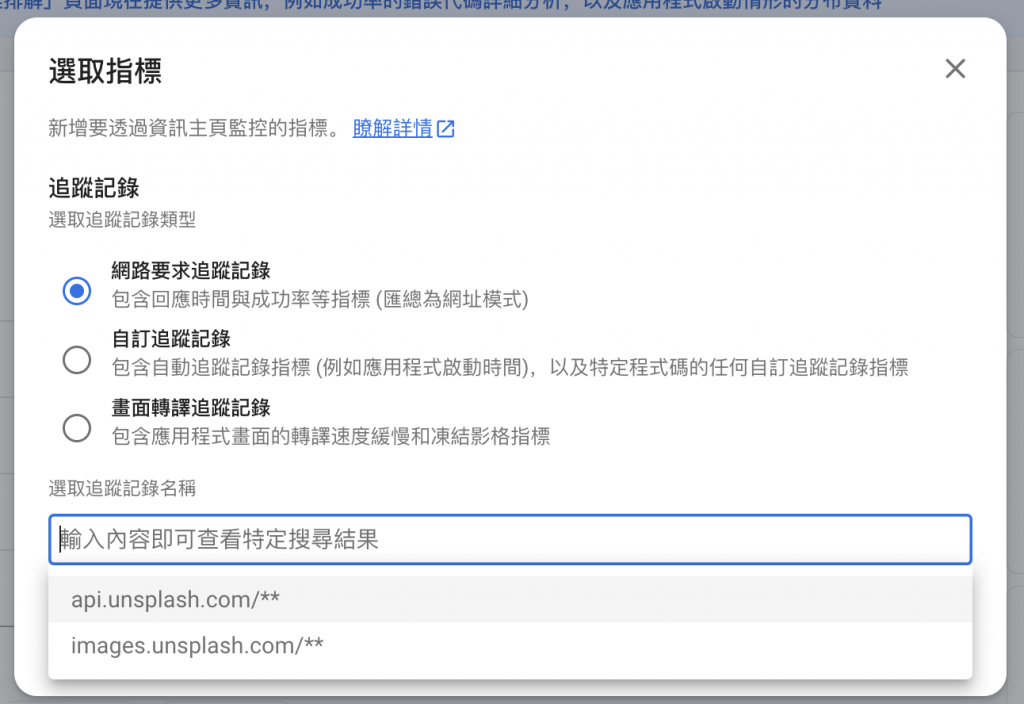
https://ithelp.ithome.com.tw/upload/images/20231001/20162496CGzNxKYxME.png

實際應用

效能指標

可以選取的效能指標三個類型:

網路要求

https://ithelp.ithome.com.tw/upload/images/20231001/20162496r9CE8A70Le.png

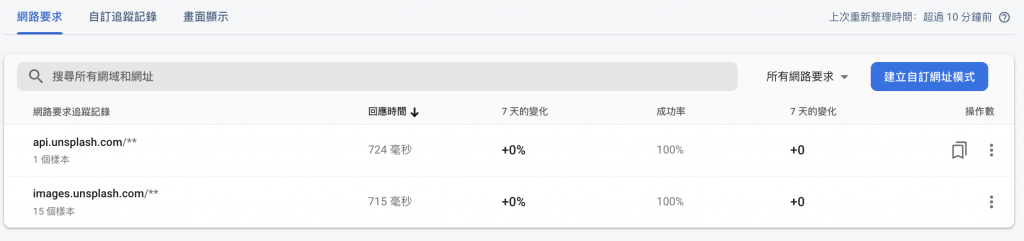
就是應用程式中呼叫的 API 的相關指標。這裡可以查看的指標包含:

  • 回應時間
  • 成功率
  • 回應 playload 大小
  • 要求 playload 大小

自訂追蹤記錄

https://ithelp.ithome.com.tw/upload/images/20231001/20162496erjZifY1jL.png

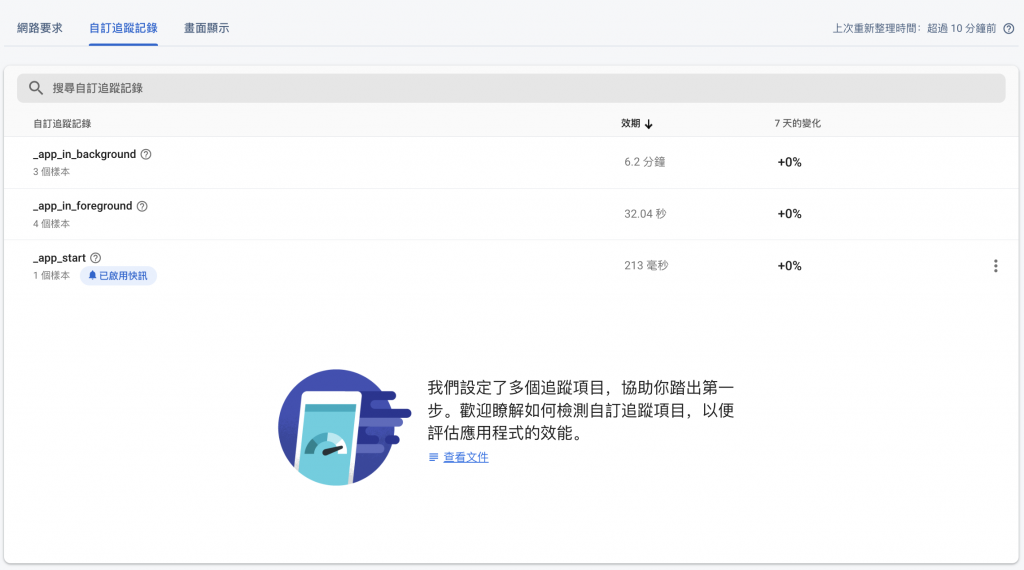
這裡可以自訂你要追蹤的特定事件或是預設的:
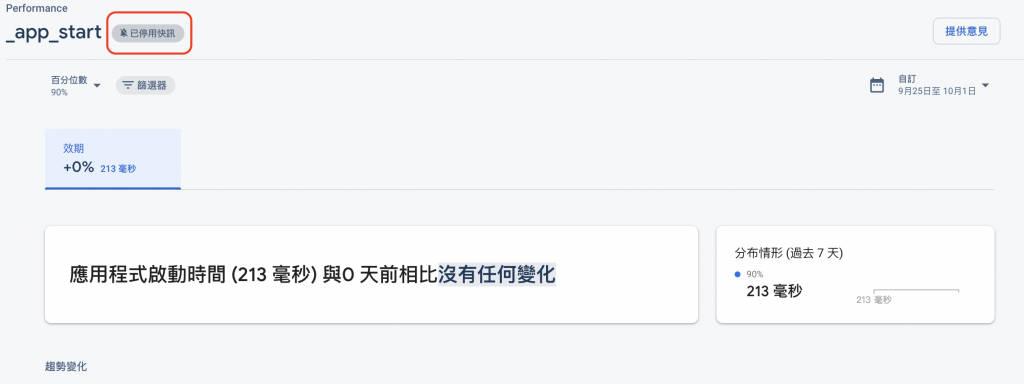
  • _app_in_background:應用程式在背景中執行的時間
  • _app_in_foreground:應用程式在前景中執行的時間
  • _app_start:應用程式啟動時間

畫面顯示

https://ithelp.ithome.com.tw/upload/images/20231001/20162496zzSPlFxFVX.png

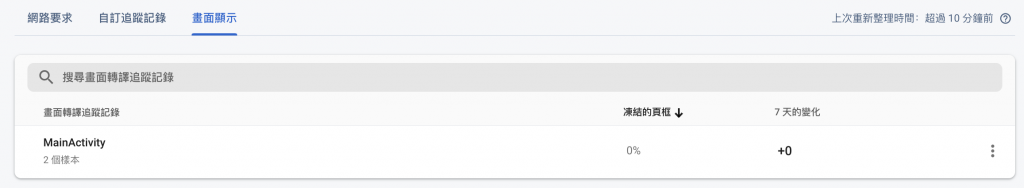
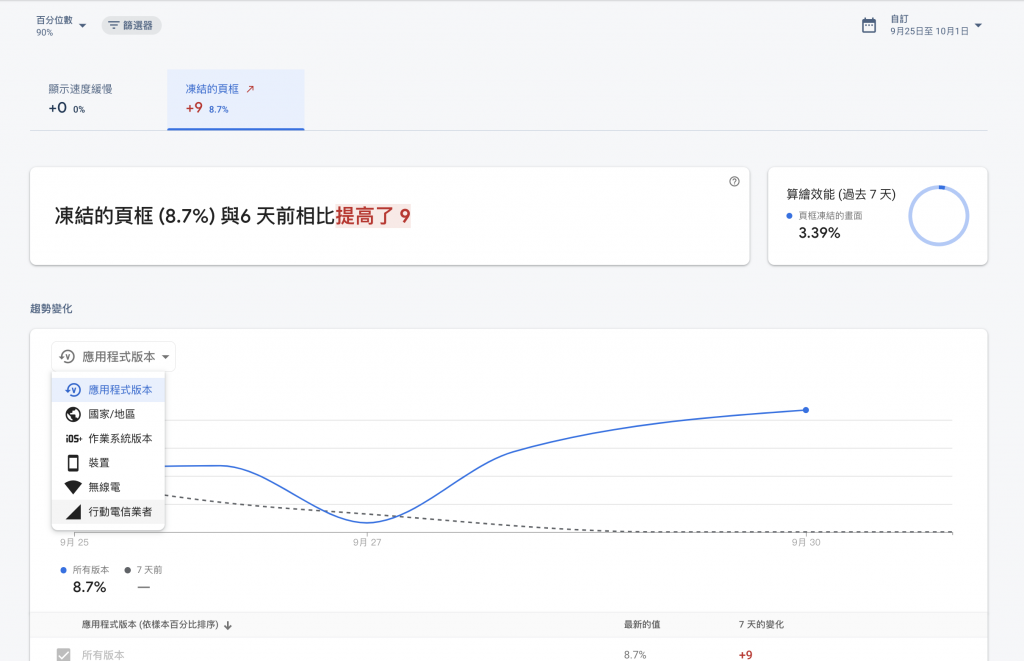
就是指應用程式畫面的轉譯速度緩慢和凍結影格指標,簡而言之,就是查看畫面是否看起來像被卡住的一個關鍵指標。

選取指標

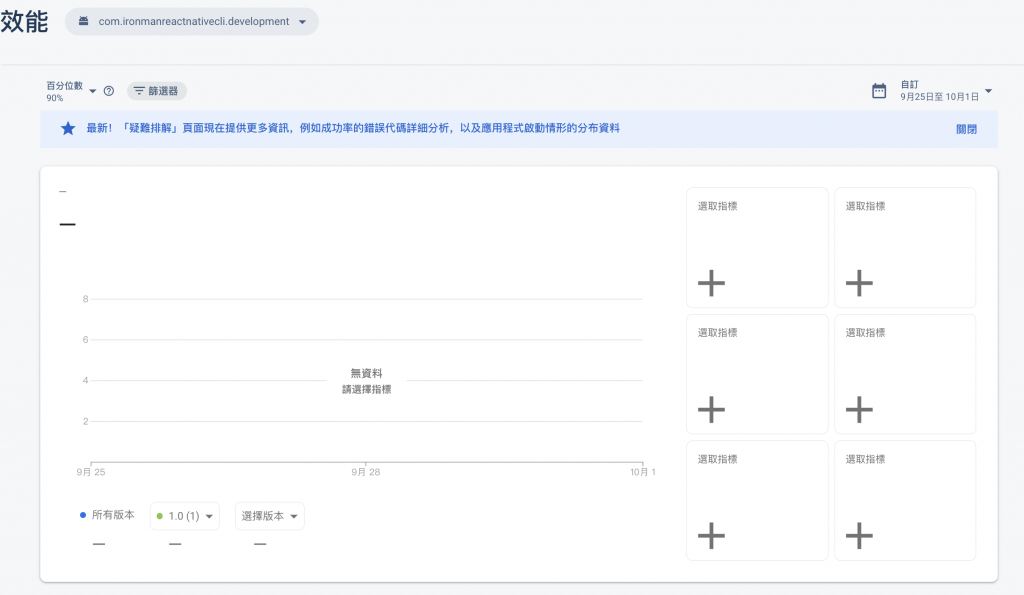
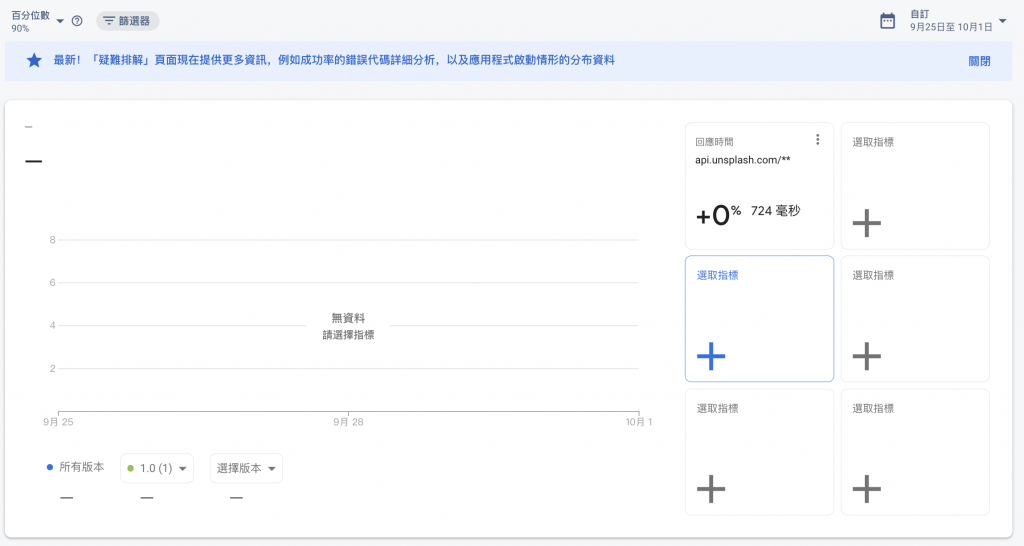
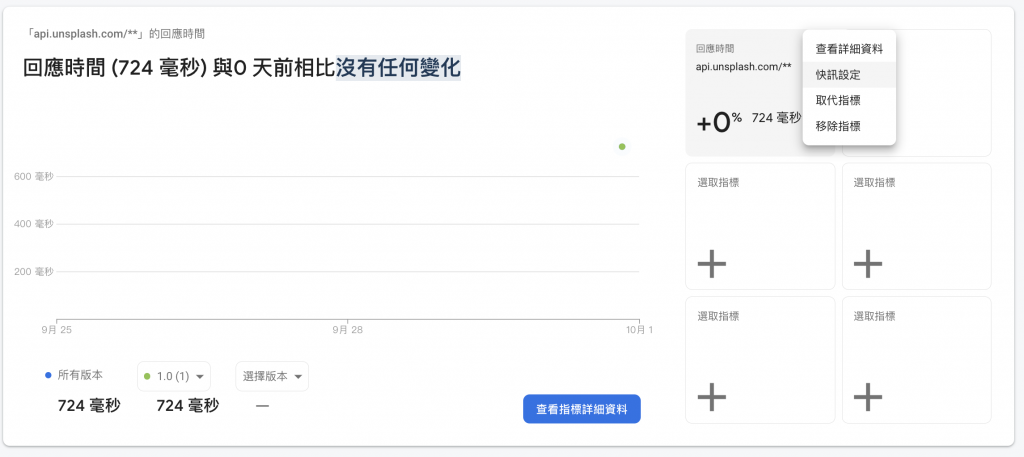
就是選擇 6 個在主頁上想看的效能指標:
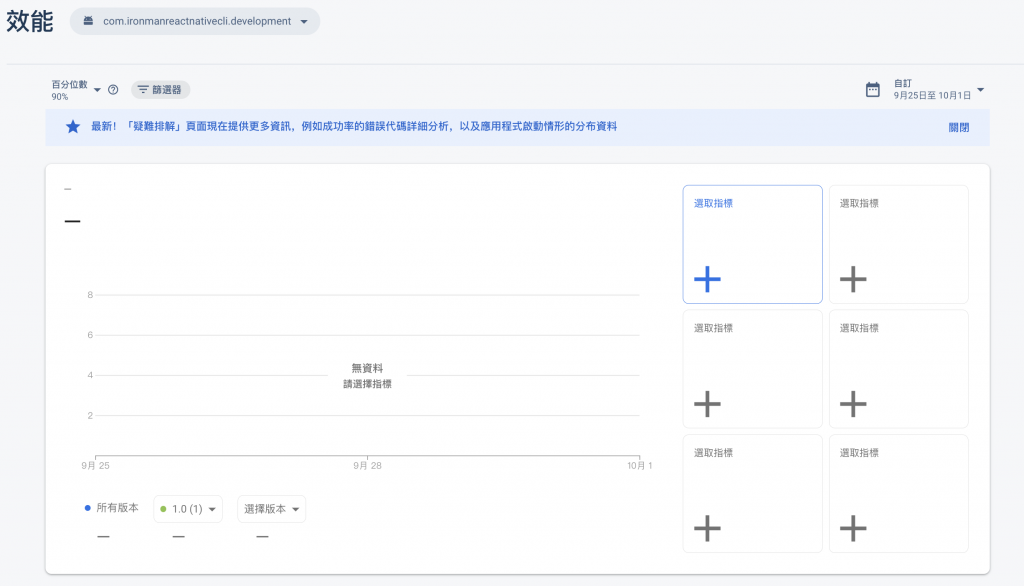
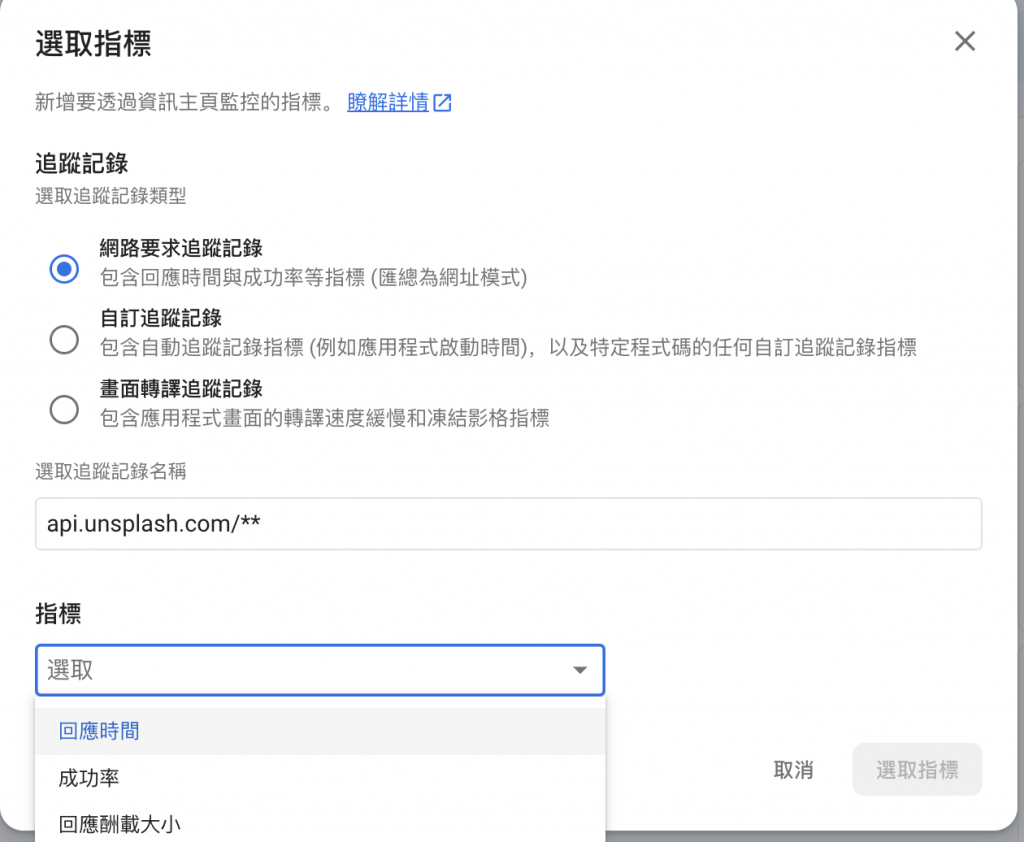
https://ithelp.ithome.com.tw/upload/images/20231001/20162496zbVcjq3Cwb.png

https://ithelp.ithome.com.tw/upload/images/20231001/20162496oHMgCC2idU.png

例如想要監控 api 回應的時間

https://ithelp.ithome.com.tw/upload/images/20231001/20162496QNvzl37tyY.png

https://ithelp.ithome.com.tw/upload/images/20231001/20162496wcbIqCIonS.png

設定完成

https://ithelp.ithome.com.tw/upload/images/20231001/20162496yMozlhgngD.png

當累積了一定的數據後大概會呈現這個樣子。會有線圖呈現一段時間內不同版本的效能指標的變化。

https://ithelp.ithome.com.tw/upload/images/20231001/201624961FtskSCBEV.png

查看單一效能指標報告

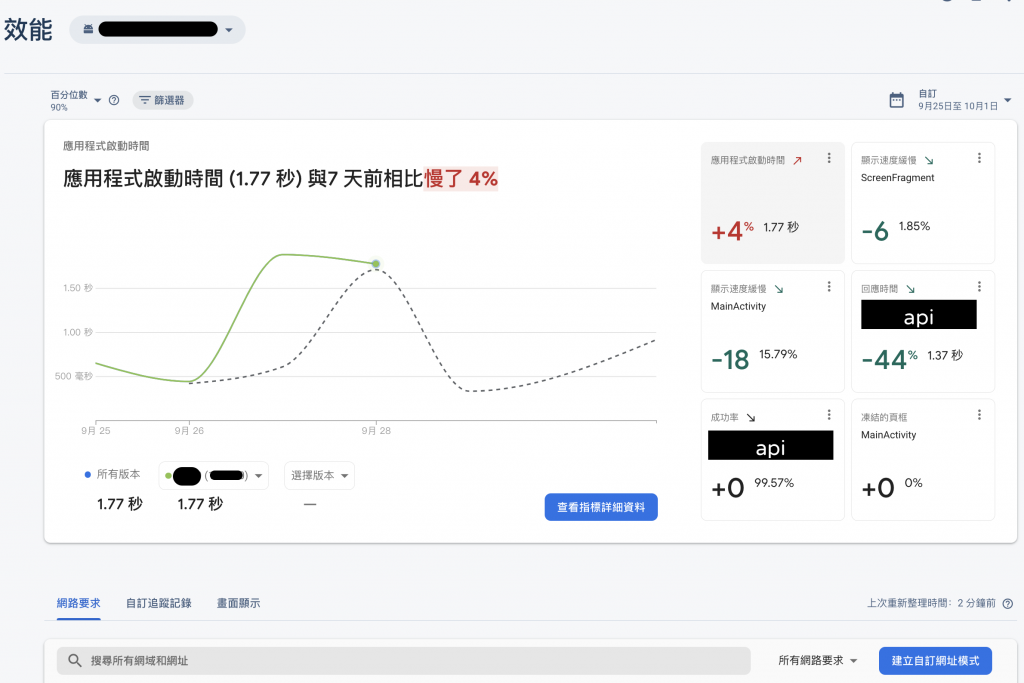
在效能報告中,會顯示該指標的趨勢變化,你也可以透過篩選特定的地區/電信/裝置/應用程式版本...等,比較不同因素的趨勢與相關效能的影響。

https://ithelp.ithome.com.tw/upload/images/20231001/20162496mGFpKPMjIV.png

設定快訊

這是一個我覺得很不錯的功能,你可以設定好你的效能指標的標準,當你的應用程式的效能未達標時,firebase 就會及時通知你。

在你要設定的效能指標旁點擊快訊設定

https://ithelp.ithome.com.tw/upload/images/20231001/20162496Ds3EyFYIGs.png

或是點擊某一個效能指標報告裡面的"已停用快訊"

https://ithelp.ithome.com.tw/upload/images/20231001/20162496ATVTDqvdwv.png

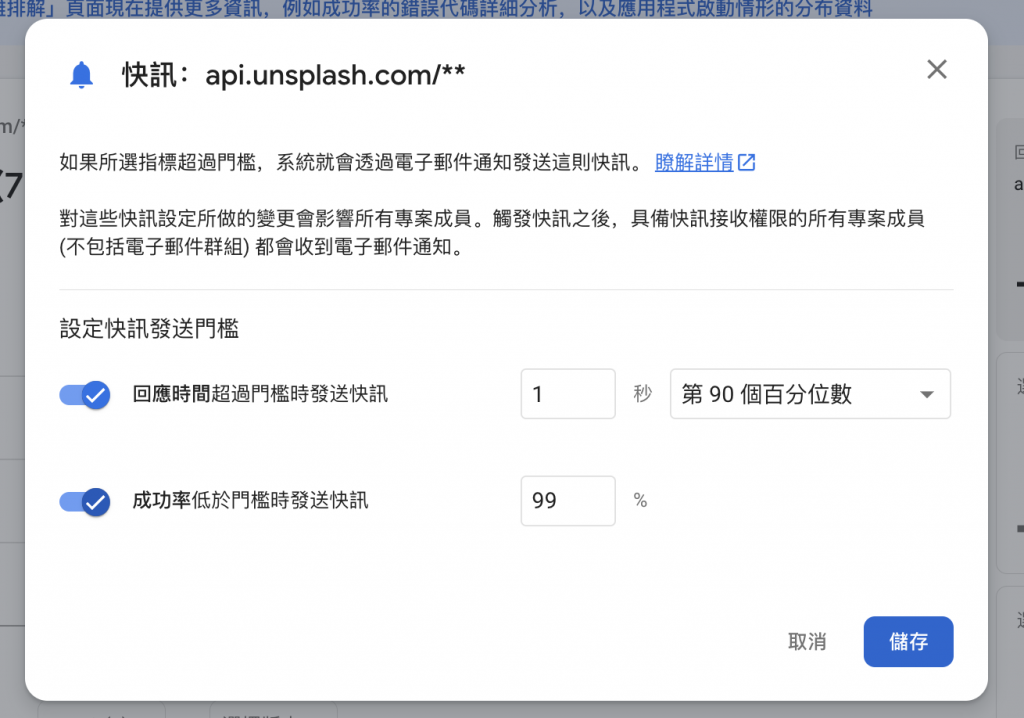
設定指標快訊發送的門檻,這邊是設定 call api.unsplash.com/ 的 api 回應時間超過 1 秒或成功率低於99%時就會發送快訊,當然這個數字是你可以自行調整的。

https://ithelp.ithome.com.tw/upload/images/20231001/20162496yxnlxjJTjn.png

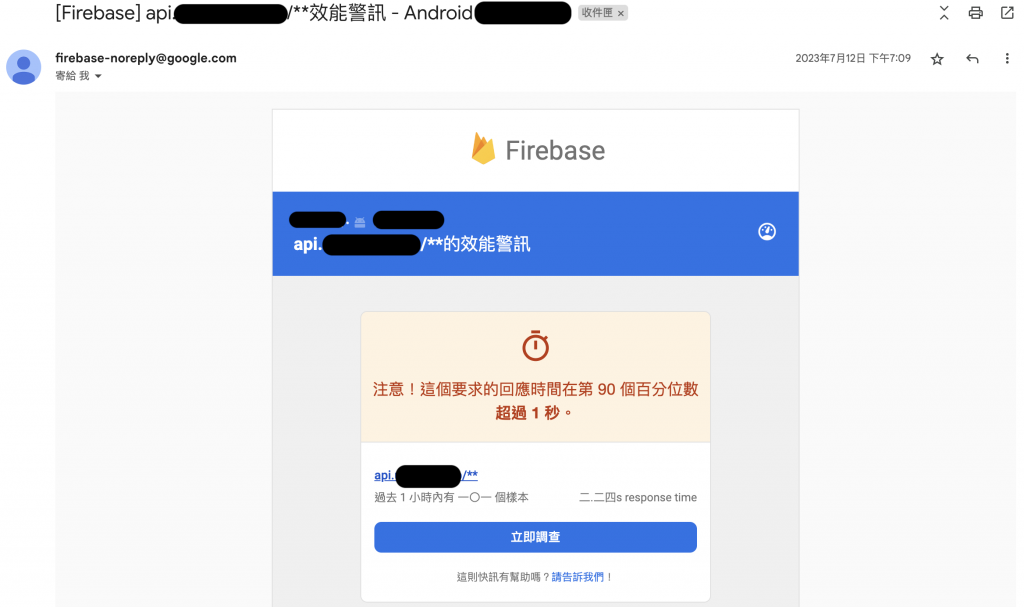
快訊的信大概會長這樣,會告訴你哪一個效能指標發生了什麼問題。
https://ithelp.ithome.com.tw/upload/images/20231001/20162496gQCp09ZnDY.png


上一篇
DAY 25 React Native 效能優化:使用 Firebase Crashlytics 追蹤應用程式 Crash
下一篇
DAY 27 React Native 效能優化:提升效能實戰 (一)
系列文
React Native CLI 開發心法31
圖片
  直播研討會
圖片
{{ item.channelVendor }} {{ item.webinarstarted }} |
{{ formatDate(item.duration) }}
直播中

尚未有邦友留言

立即登入留言