嗚呼 總算脫離 Prometheus 了 (並沒有 之後還有一些要設定的東西
總之就先來安裝 Grafana 並且讓他連上 Prometheus 吧
依照官方安裝流程安裝
先來把 Grafana 的 APT repository 新增進來
apt-get install -y apt-transport-https software-properties-common wget
mkdir -p /etc/apt/keyrings/
wget -q -O - https://apt.grafana.com/gpg.key | gpg --dearmor | tee /etc/apt/keyrings/grafana.gpg > /dev/null
echo "deb [signed-by=/etc/apt/keyrings/grafana.gpg] https://apt.grafana.com stable main" | tee -a /etc/apt/sources.list.d/grafana.list
apt-get update
新增完成後就可以來安裝 Grafana 了
apt-get install grafana -y
安裝完先來確定服務有沒有正常運作
service grafana-server status
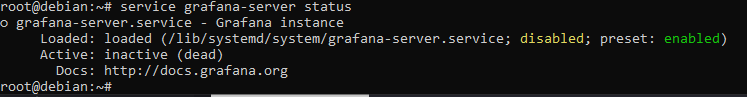
涼透了 根本還沒動 就算他有動接下來還是要來看 Grafana 的 Config
cd /etc/grafana
nano grafana.ini
這邊改幾個設定就好
[server]
    protocol = http
    http_port = 80
    domain = grafana.ironman.test
存檔離開然後多設定一個檔案
Grafana 如果要使用 < 1024 的 Port 要額外設定 Systemd
mkdir -p /etc/systemd/system/grafana-server.service.d/-server.service.d/
nano /etc/systemd/system/grafana-server.service.d/override.conf
[Service]
CapabilityBoundingSet=CAP_NET_BIND_SERVICE
AmbientCapabilities=CAP_NET_BIND_SERVICE
PrivateUsers=false
重載入 systemd + grafana + systemctl enable 伺候
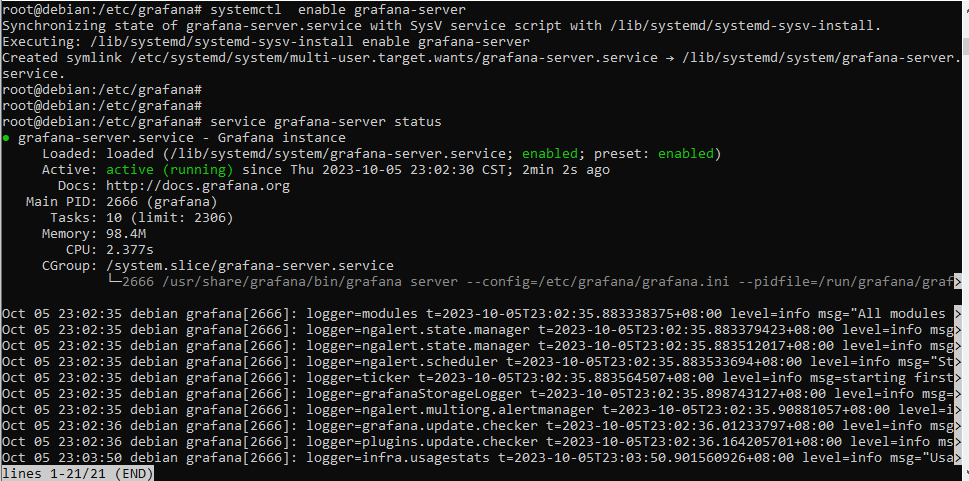
讓 Grafana 起來後看看 Status
systemctl daemon-reload
service grafana-server restart
systemctl enable grafana-server
service grafana-server status
接著用管理介面打開看看
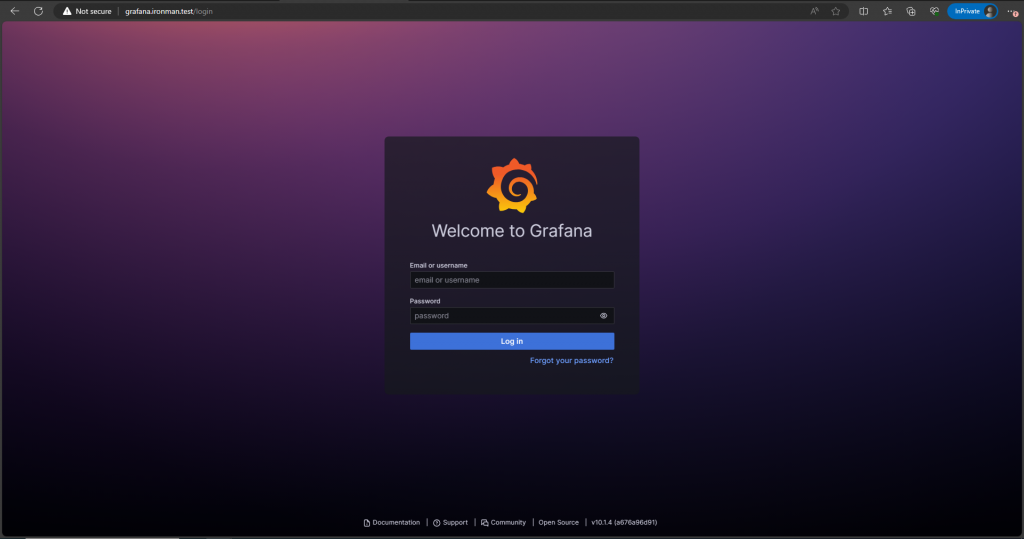
好棒 接下來用 admin admin 進入 第一次登入後會叫你更改密碼
改完就會進主頁面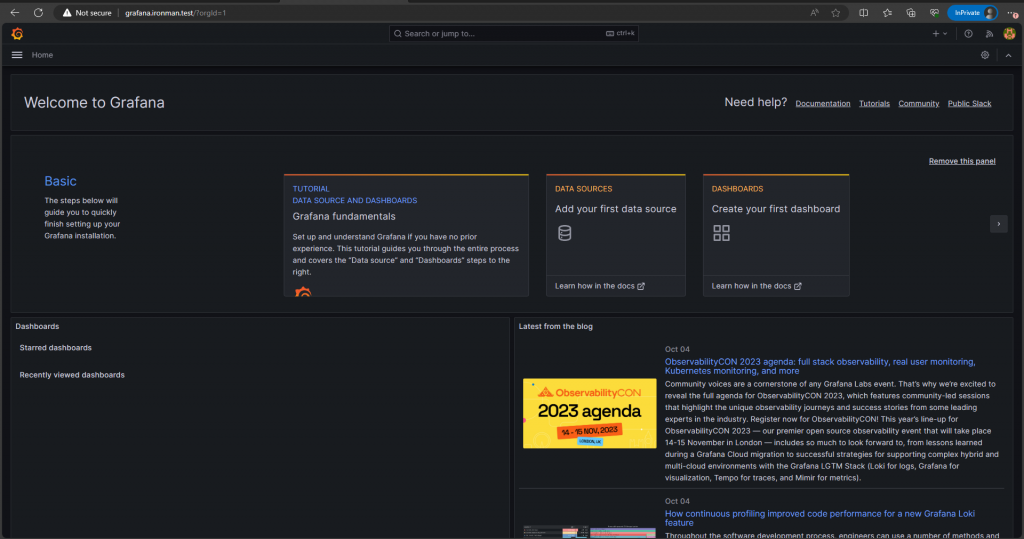
好欸 接著來設定資料和介面吧
在主頁面按 Data source
接著就會看到 Prometheus 在第一個 就順順的按下去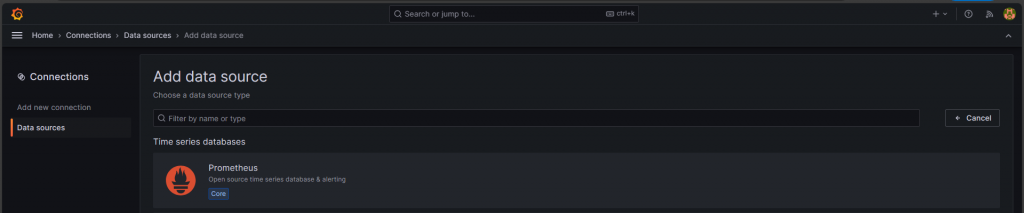
接著在 HTTP 這邊敲入 Prometheus 的網頁介面和設定 Timeout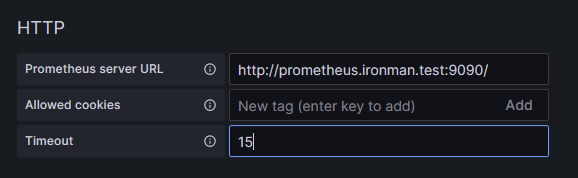
接著到最下面按下 Save & Test 若是成功就成功了(??
最後來設定 Dashboard 讓我們看看 Metric 吧
這次就使用 Import 來設定 Dashboard
回到主頁面按左邊的列表 按 Dashboard 進入 Dashboard 的介面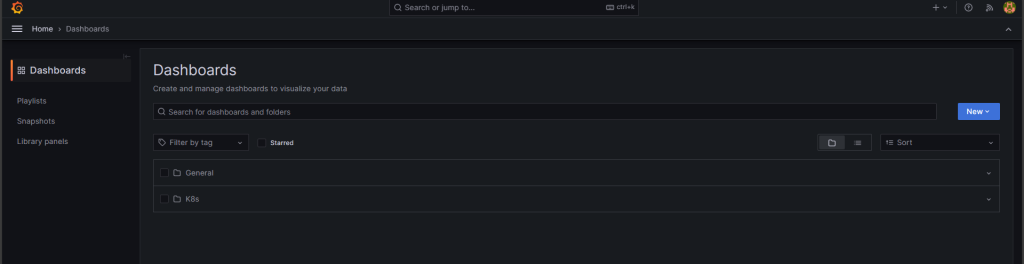
然後按下右邊的藍色 News 下拉選單按 Import
把要 Import 的 Dashboard 用 ID 或 JSON 的方式貼上
這邊使用 Node Exporter 的來當範例
最後在選擇資料來源就可以了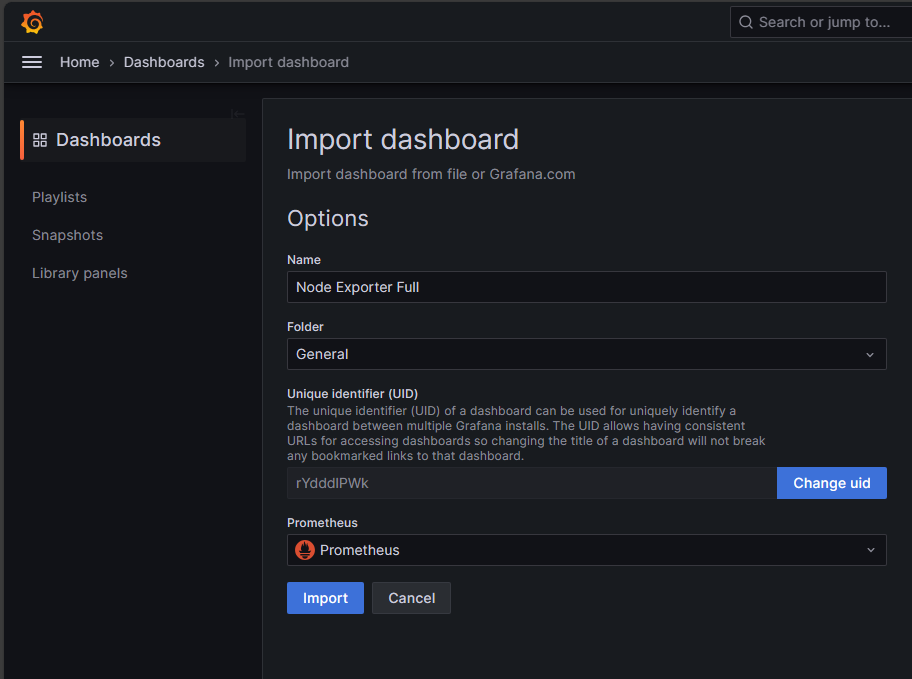
按下 Import 就可以看到畫面了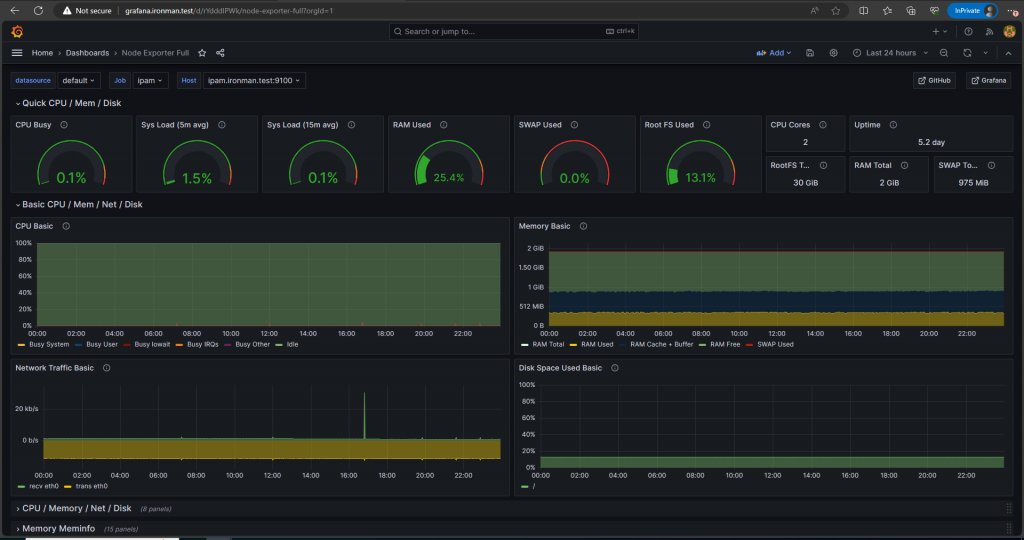
大成功