Loki 是拿來集中存放 Log 且能夠以近似 Prometheus 的格式來查看
還提供了 Log-based Metrics(基於 Log 的 Metric) 提供給 Prometheus 抓取再給 Grafana 監控
那就來安裝吧 這邊安裝在 Prometheus 上
因為 Prometheus 的 Server 上並沒有 Grafana 的 APT Source 所以這邊在敲一次昨天新增的指令
apt-get install -y apt-transport-https software-properties-common wget
mkdir -p /etc/apt/keyrings/
wget -q -O - https://apt.grafana.com/gpg.key | gpg --dearmor | tee /etc/apt/keyrings/grafana.gpg > /dev/null
echo "deb [signed-by=/etc/apt/keyrings/grafana.gpg] https://apt.grafana.com stable main" | tee -a /etc/apt/sources.list.d/grafana.list
apt-get update
搞定 APT 醬汁後就來安裝 Loki 和 Promtail(Agent)
apt-get update
apt-get install loki promtail -y
理論上這樣就可以了 接著來改 Loki 的設定檔
vim /etc/loki/config.yml
調整 Listen 的 Address
common:
  instance_addr: 10.0.0.5
接著重啟 Loki
service loki restart
重開好後到 Grafana 上先加入 Data Source
在主頁面左側選單點開後 Connection -> Data Sources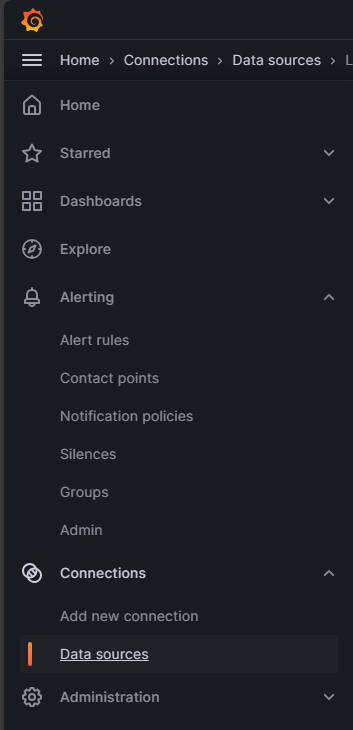
接著填入 Loki 的 DNS / IP 之後到下方 Save & Test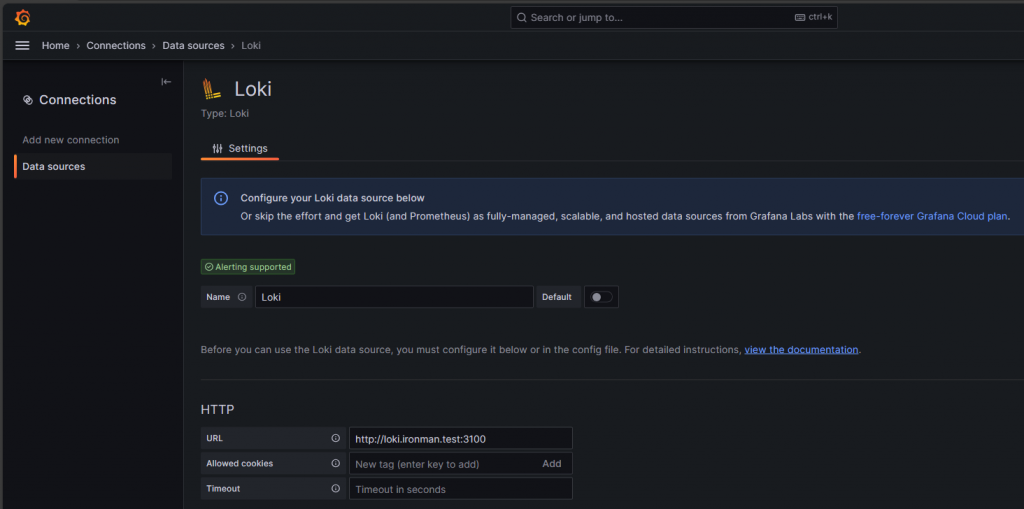
也是要看到這個成功的訊息後才能安心離開
接下來設定 Promtail 準備集中 Log 到 Loki 上
摁 這邊也是要做大量部署的 所以把之前部署 Node-Exporter 的 Ansible 搬出來改吧
---
- name: Deploy_promtail
  hosts: target
  tasks:
    - name: update apt package list before install prerequiresite
      ansible.builtin.apt:
        update_cache: yes
    - name: Install prerequisite packages for Promtail
      ansible.builtin.apt:
        name:
        - apt-transport-https
        - software-properties-common
        - wget
    - name: Ensure directory for keyrings exists
      ansible.builtin.file:
        path: /etc/apt/keyrings/
        state: directory
    - name: Fetch and store Grafana GPG key
      ansible.builtin.get_url:
        url: https://apt.grafana.com/gpg.key
        dest: /tmp/grafana.gpg.key
    - name: Dearmor the Grafana GPG key
      ansible.builtin.command:
        cmd: gpg --dearmor -o /etc/apt/keyrings/grafana.gpg /tmp/grafana.gpg.key
        creates: /etc/apt/keyrings/grafana.gpg exists
    - name: Add Grafana APT repository
      ansible.builtin.lineinfile:
        path: /etc/apt/sources.list.d/grafana.list
        line: "deb [signed-by=/etc/apt/keyrings/grafana.gpg] https://apt.grafana.com stable main"
        create: yes
        state: present
    - name: update apt package list before install promtail
      ansible.builtin.apt:
        update_cache: yes
    - name: Install promtail
      ansible.builtin.apt:
        name: promtail
        state: present
    - name: Replace loki server endpoint
      ansible.builtin.replace:
        path: /etc/promtail/config.yml
        regexp: 'http://localhost'
        replace: 'http://loki.ironman.test'
    - name: Make sure a service unit is running and startup when booting
      ansible.builtin.systemd_service:
        name: promtail
        state: restarted
        enabled: true
接著來 play 看看
ansible-playbook Inst-promtail.yaml
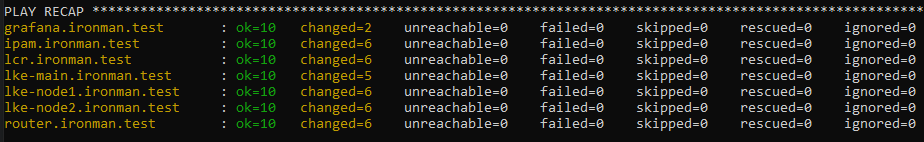
出來的成果應該會跟這個數字差不多
Grafana 的主機因為原本就有 GPG dearmor 過了
在這邊重新 de 一次有機會出錯 可以考慮 Grafana 的 Promtail 手動安裝或寫出更好的 Ansible 來防止意外
最後就到 Grafana 的 Loki 頁面上看看吧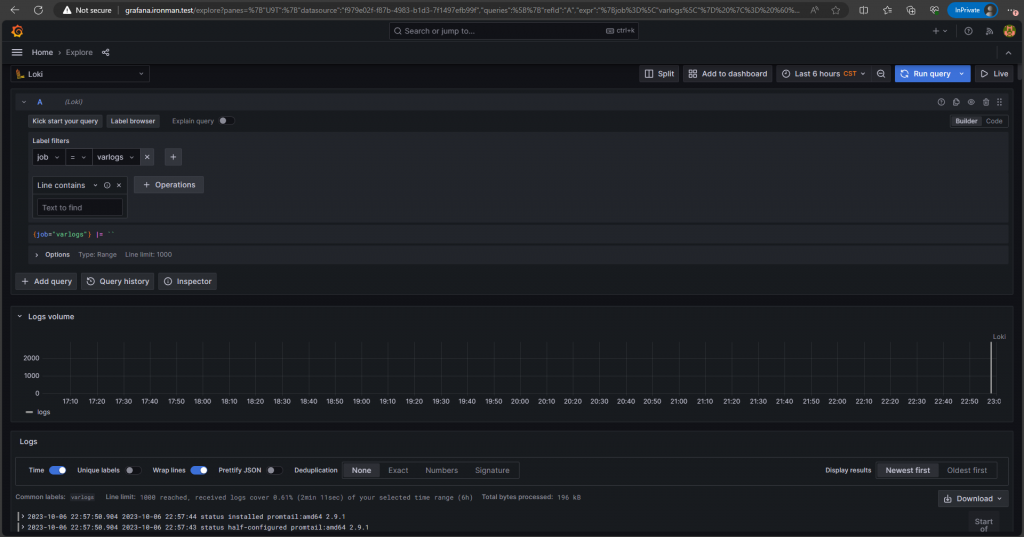
看起來有了 很棒
但是現在翻 Log 會發現根本不知道這個 Log 是來自哪裡的
明天來解決這個問題