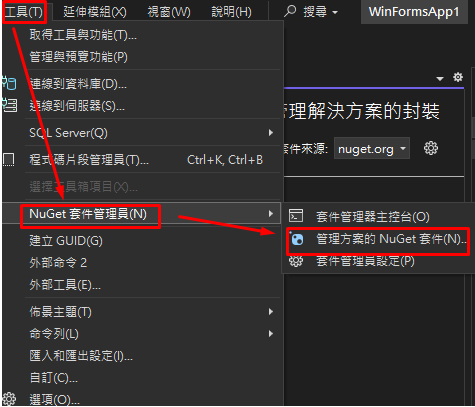
ScottPlot 是一個用於在C# WinForms應用程式中繪製高品質科學圖形的強大工具
Plot:
使用 ScottPlot.Plot 創建一個新的圖表,指定寬度和高度。
var plt = new ScottPlot.Plot(width, height);
plt.Grid(true);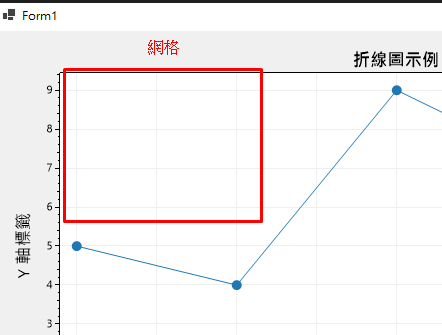
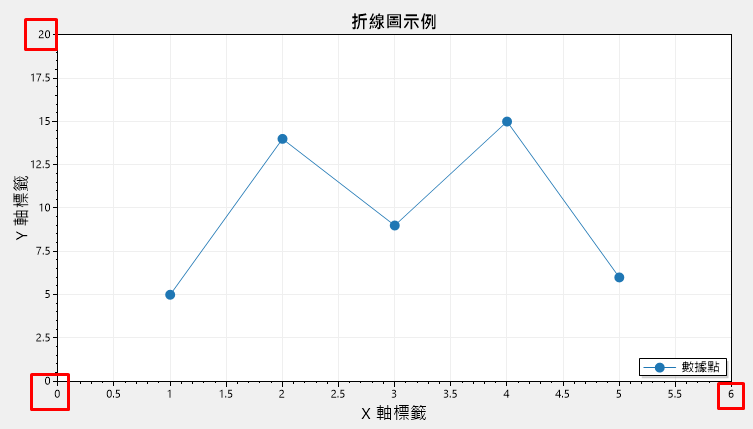
//(Xmin,XMax,Ymin,YMax)
Plot.SetAxisLimits(0, 6, 0, 20);
//(Xmin,XMax)
Plot.SetAxisLimitsX(0, 6);
//(Ymin,YMax)
Plot.SetAxisLimitsY(0, 20);
plt.Legend(); 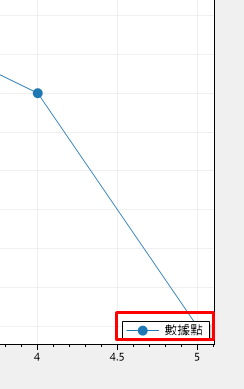
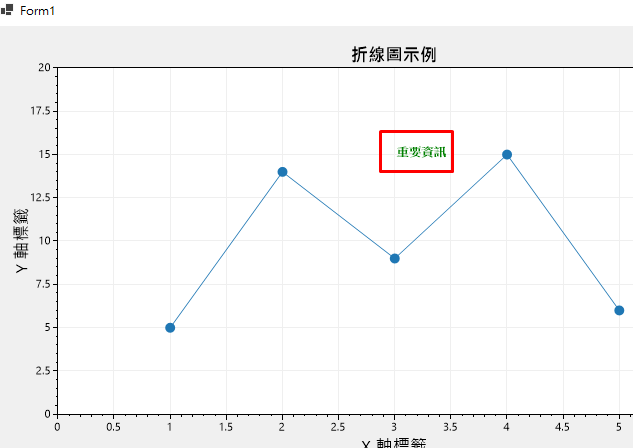
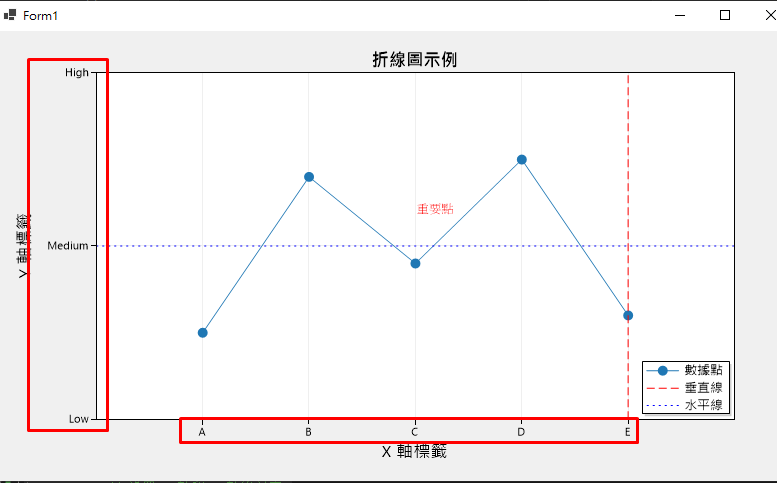
plt.PlotText("重要資訊", x: 3, y: 15, fontSize: 12, color: Color.Green, bold: true);
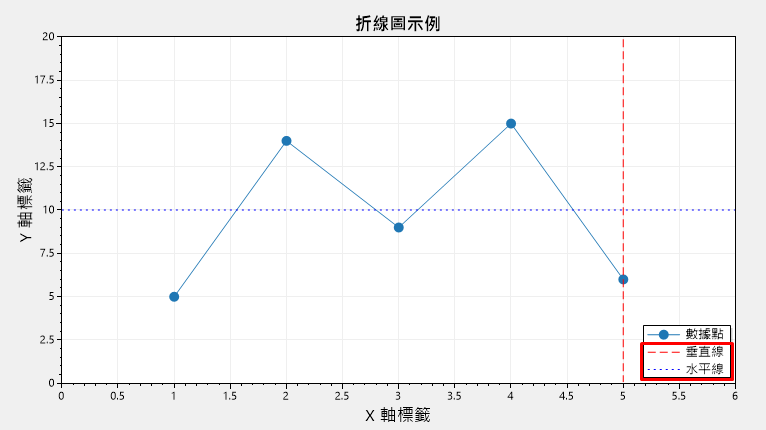
// 添加垂直線
Plot.PlotVLine(5, label: "垂直線", color: Color.Red, lineStyle: LineStyle.Dash);

// 添加水平線
Plot.PlotHLine(10, label: "水平線", color: Color.Blue, lineStyle: LineStyle.Dot);
Plot.XTicks(new double[] { 1, 2, 3, 4, 5 }, new string[] { "A", "B", "C", "D", "E" });
Plot.YTicks(new double[] { 0, 10, 20, 30 }, new string[] { "Low", "Medium", "High", "Max" });
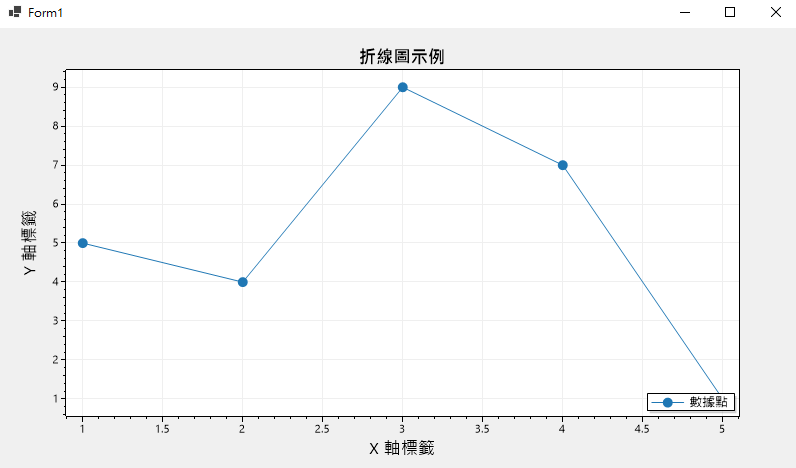
PlotScatter:
使用 PlotScatter 方法添加一組數據點,生成折線圖。
plt.PlotScatter(double[] xs, double[] ys, double markerSize = 5, string label = null);
var Plot = formsPlot1.Plot;
// 添加數據
double[] xs = { 1, 2, 3, 4, 5 };
double[] ys = { 5, 4, 9, 7, 1 };
plt.PlotScatter(xs, ys, markerSize: 10, label: "數據點");

// 設置標籤和標題
plt.Title("折線圖示例");
plt.XLabel("X 軸標籤");
plt.YLabel("Y 軸標籤");
Plot.Legend(); //顯示圖例的標籤
formsPlot1.Refresh();
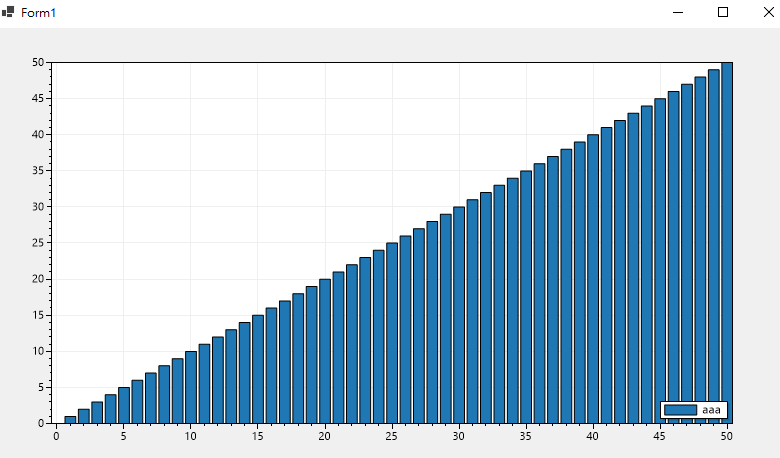
PlotBar:
使用 PlotBar 方法添加一組條形圖數據。
plt.PlotBar(double[] positions, double[] values, double barWidth = 0.8, string label = null);
    var Plot = formsPlot1.Plot;
    double[] xs = DataGen.Consecutive(51);
    double[] ys = DataGen.Consecutive(51);
    Plot.PlotBar(xs, ys, barWidth:0.8, label: "aaa");
    Plot.Legend(); //顯示圖例的標籤
    formsPlot1.Refresh();
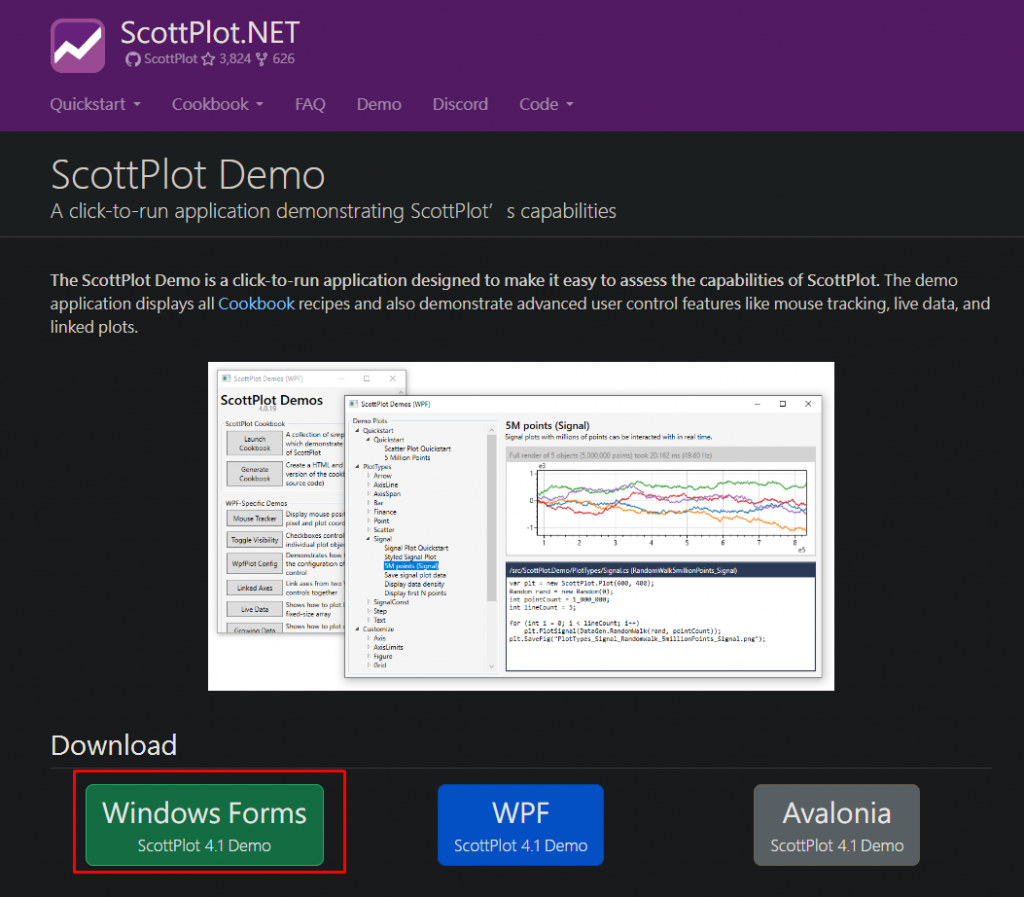
更多可以查看的範例,可以再參考官網Demo
期望挑戰30天持續更新成功 ~ DAY26


 iThome鐵人賽