Grafana Loki 的天花板非常高,可負載量級從輕量的 MB 的到 TB 都有其發揮表現的舞台,儲存的選擇更是可以從一般的本地文件系統橫跨到雲端的物件存儲系統,而在安裝設定上,提供了最簡單的單體式模式跟最細膩的微服務模式。可想而知,Grafana Loki 提供了我們相當豐富的設定來對應各種需求,同時也產生一定的問題,現在就讓我們來看看,如何將 Loki 應對各種設定細解,並將其調教至最適合我們的應用場景吧。
這是一條漫長的旅程,在我們使用 Grafana Loki 後,代表著當你成功運作起了它時,只是一個全新的開始。

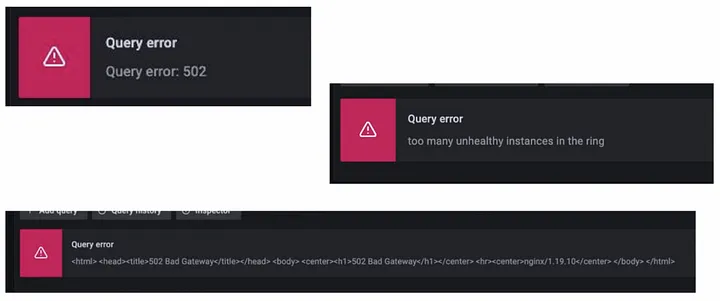
相信在大多數人剛開始使用 Grafana Loki 後,最常遇到的問題就當在大範圍查詢時很容易失敗,可能是因為效能或傳輸,現在我們就以這點切入排查,一層一層揭開這些問題的神秘面紗。
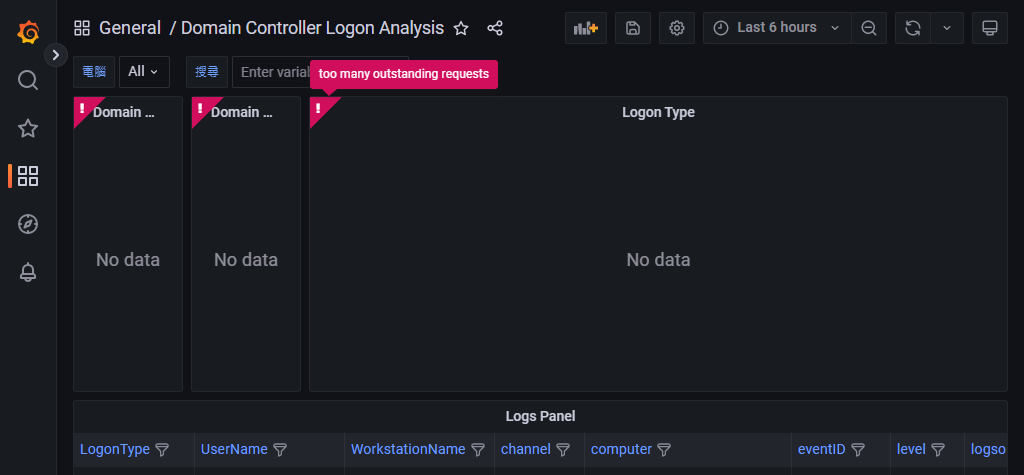
當我們在 Grafana 介面中處理大範圍查詢時,大多數的超時問題都來自請求發送之後經過的組件或服務中,仔細探討後,我們可以注意到這些服務都如以下這些種類:
在實際生產環境中,每個地方的架構有簡單有複雜情況不一,所以在處理這類問題時,我們需要依照實際情況去每道處理請求的關卡中實際調整,才能達到根治問題的效果。
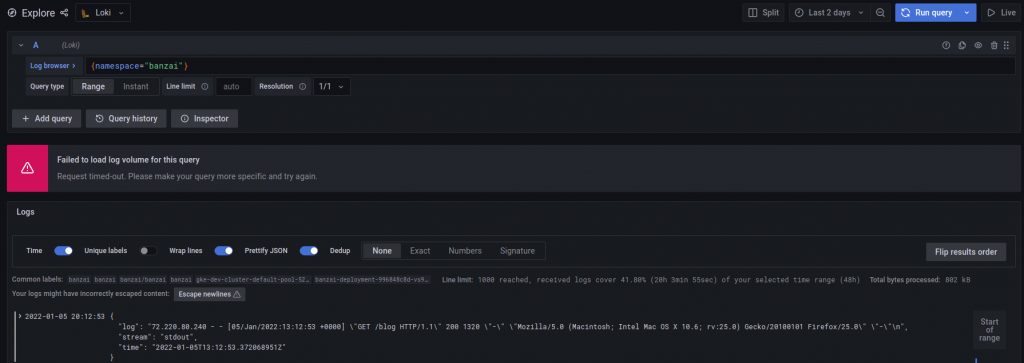
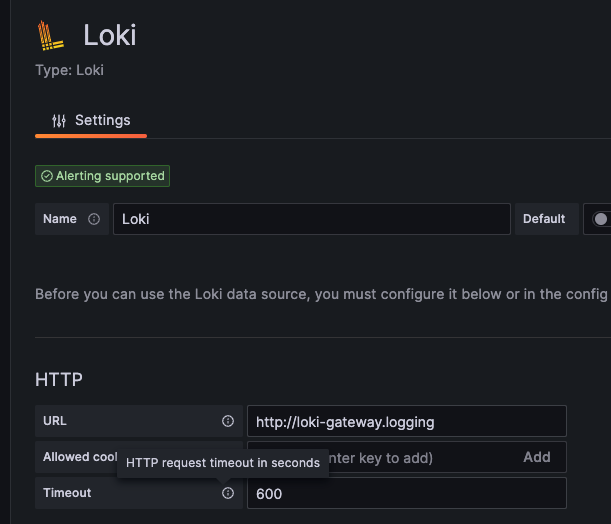
在我們可視化介面 Grafana 的第一道關卡就是一個典型的網頁服務,在此 Grafana 對 data source 的預設超時設定為 30 秒,所以我們很容易得到 Timeout 的錯誤,以下我們有兩種方式調整這項 dataproxy 的超時時間。
# grafana
grafana.ini:
...
		dataproxy:
			logging: true
			timeout: 600 # default 30s
...
如果有再額外使用 nginx-ingress controller 作為進入 Loki 第一道關卡的同學,很容易忽略的一個問題,就是 nginx-ingress 本身也是一個代理服務器,也有其超時設定,所以有可能需要依實際情況在 Ingress 設定檔中的 annotations 調整相關設定。
...
annotations:
    nginx.ingress.kubernetes.io/proxy-connect-timeout: "600"
    nginx.ingress.kubernetes.io/proxy-read-timeout: "600"
    nginx.ingress.kubernetes.io/proxy-send-timeout: "600"
...
別忘了我們使用 loki-gateway 組件本身的也是個 nginx 服務,也需要對其做出調整。
# values.yaml(helm)
gateway:
	nginxConfig:
	  file: |
			//...
	    http {
				//...
				proxy_read_timeout 600s;
	      //...
	      }
	    }
在 Loki 設定中可以針對每個組件的 HTTP 端口調整超時設定。
# loki-config
server:
  http_server_read_timeout: 600s # dafault 30s
  http_server_write_timeout: 600s # dafault 30s
  http_server_idle_timeout: 600s # dafault 2m
在 Loki 設定中也有針對 Querier 最大超時的設定有機會導致超時錯誤。
# loki-config
limits_config:
    # set the maximum timeout for queries
    query_timeout: 10m # default 1m
在 Loki 查詢的過程中,會不斷的傳遞塊及索引資料,最終才能組合出我們預期的完整結果出來,而其中的溝通過程涉及大量資料傳遞。Loki 預設為我們設定每個訊息最大不能超過 4 Mb 的限制來保護記憶體過度使用,並且發出對應錯誤。
但有時我們仍然有儲存及查詢龐大日誌的需求,所以我們可以調整一下參數:
# loki-config
server:
  grpc_server_max_recv_msg_size: 104857600  # default 4 Mb
  grpc_server_max_send_msg_size: 104857600  # default 4 Mb

ingester_client:
  grpc_client_config:
    max_recv_msg_size: 104857600  # default 100 Mb
    max_send_msg_size: 104857600  # default 100 Mb
Loki 強大的其中的一點在於,它可以將龐大的查詢任務以時間區間拆分成更小的任務平行處理。
其調整需要根據實際運作取捨:
# loki-config
limits_config:
	split_queries_by_interval: 1h # default 30m
查詢設定中的併行也很大程度的影響查詢的結果與性能:
# loki-config
querier:
  max_concurrent: 8

query_scheduler:
  max_outstanding_requests_per_tenant: 2048

limits_config:
  max_query_parallelism: 24

frontend_worker:
  match_max_concurrent: true
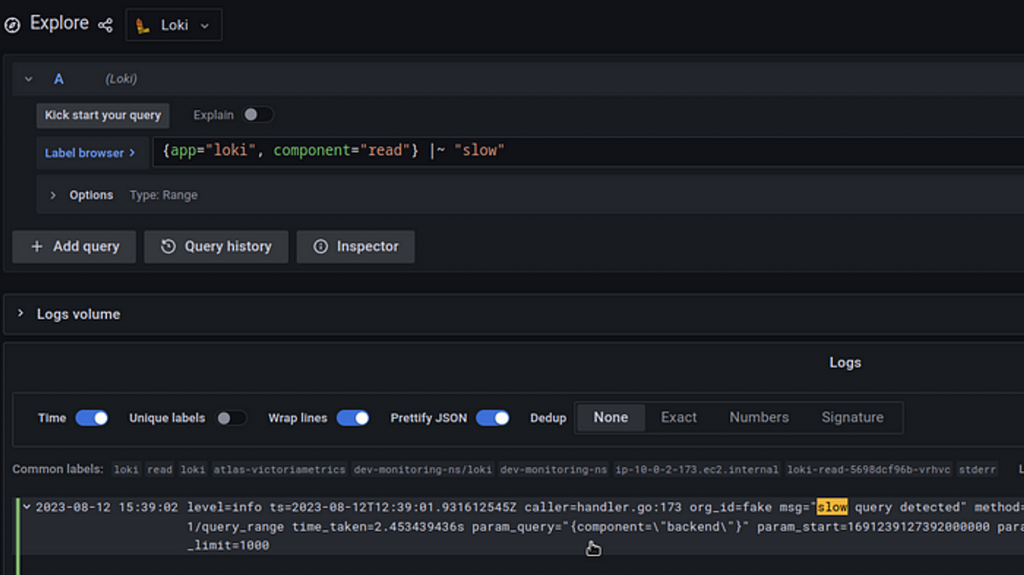
如果我們想要針對慢查詢進行除錯時,我們可以開啟 Loki 的查詢日誌紀錄功能。
# loki-config
frontend:
	# Set to < 0 to enable on all queries.
  log_queries_longer_than: 1s # default 0 === disabled
基本上在 Grafana Loki 上的讀寫組件都可以做緩存,並且在 Helm 設定檔中使用非常容易,不論是什麼安裝模式下都可以嘗試看看。
# values.yaml(helm)
memcachedExporter:
  enabled: true

memcachedChunks:
  enabled: true
  replicas: 1
  resources: {}

memcachedFrontend:
  enabled: true
  replicas: 1
  resources: {}

# TSDB not required
memcachedIndexQueries:
  enabled: false
  replicas: 1
  resources: {}

# TSDB not required
memcachedIndexWrites:
  enabled: false
  resources: {}
從上面的 Helm 參數設定檔設定中,有幾個特別地方:
可以在上面的設定中發現,不論是超時或者是併行問題,某方面都是指向效能方便的問題。要是今天我們可以使 Loki 的查詢資源十分彈性,在需要大範圍查詢時,依照任務數量多寡自動水平擴展,可以帶來十分有效率的使用體驗。Grafana Loki 推薦的 KEDA 服務正式通過在 Kubernetes Pod 上設定特定指標,根據事件的數量或其他屬性來縮放應用程序,從而實現了基於事件的自動擴展。
以下為官方針對實際任務隊列中的數量級距,所推薦的設定:
apiVersion: keda.sh/v1alpha1
kind: ScaledObject
metadata:
  name: querier
  namespace: loki-cluster
spec:
  maxReplicaCount: 50
  minReplicaCount: 10
  scaleTargetRef:
    kind: Deployment
    name: querier
  triggers:
  - metadata:
      metricName: querier_autoscaling_metric
      query: sum(max_over_time(cortex_query_scheduler_inflight_requests{namespace="loki-cluster", quantile="0.75"}[2m]))
      serverAddress: http://prometheus.default:9090/prometheus
      threshold: "4"
    type: prometheus
  advanced:
    horizontalPodAutoscalerConfig:
      behavior:
        scaleDown:
          stabilizationWindowSeconds: 1800
KEDA 是雲原生生態中,非常強大的水平擴展工具並且支援多種驅動來源,使 Kubernetes 叢集達到真正無死角的擴展彈性。
Grafana Loki 給我了我們良好的預設寫入設定,通常我們不太需要去特地調整其性能方面的設定,但我們依然可以從其他角度進行優化。
# loki-config
limits_config:
	ingestion_rate_mb: 4 # default 4(MB)
	ingestion_burst_size_mb: 6 # default 6(MB)
	per_stream_rate_limit: 3MB
	per_stream_rate_limit_burst: 15MB
此兩組參數概念非常相似,都可以在某個方面限制數據流量。
如果你把整個系統看作是一條公路,前一組參數控制的是整個公路上所有車輛的總速率,而第二組參數控制的是單一車輛的速率。
雖然 Loki 中的 Ingester 組件擁有 Wal 組建加上持久存儲的 PVC 機制來防止資料遺失,但依然會有單點失敗掉資料的風險,這時我們可以設定一個以上的副本因子到不同的 Ingester 節點上造成資料冗餘,進而實現容錯高可用的概念。
# loki-config
common:
  replication_factor: 3
以上 replication_factor 實際上代表著:
最大容忍節點數量: maxFailure = floor(replication_factor / 2) + 1
Distributor 組件把資料發送到三個 Ingester 組件上,最終將儲存三倍的資料量,而這時候就是 Compactor 組件發揮出刪除重複資料塊的場景所在。
在存儲上,我們可以對於存儲策略、保留時間、以及對塊及索引做出最適合自己的調整。
使用對象存儲是我們在生產環境首要選擇,也是 Grafana Loki 比其他日誌解決方案比較中,成本拉開差距的關鍵因素,也是最大賣點。
schema_config:
  configs:
    - from: 2020-07-01
      store: boltdb-shipper
      object_store: gcs
      schema: v11
      index:
        prefix: index_
        period: 24h

storage_config:
  boltdb_shipper:
    active_index_directory: /loki/boltdb-shipper-active
    cache_location: /loki/boltdb-shipper-cache
    cache_ttl: 24h         # Can be increased for faster performance over longer query periods, uses more disk space
    shared_store: gcs
  gcs:
      bucket_name: <bucket>
在上面的設定中我們需要先在 storage_config 設定 gcs 數值,並且在 object_store 中指定使用 gcs。
注意:我們需要在 Kubernetes 叢集對會直接讀寫 GCS Bucket 的組件,例如:Ingester、Querier、Compactor 等組件,設定對應足夠權限的 Service Account。
Compactor 組件可以擔任對重複資料進行刪除的角色,並且可以將較小的索引合併,達到提高效率的作用。
compactor:
  working_directory: /data/retention
  shared_store: gcs
  compaction_interval: 10m
  retention_enabled: true
  retention_delete_delay: 2h
  retention_delete_worker_count: 150z
limits_config:
  retention_period: 90d
schema_config:
    configs:
      - from: "2020-07-31"
        index:
            period: 24h
            prefix: loki_index_
        object_store: gcs
        schema: v11
        store: boltdb-shipper
storage_config:
    boltdb_shipper:
        active_index_directory: /data/index
        cache_location: /data/boltdb-cache
        shared_store: gcs
    gcs:
        bucket_name: loki
同時開啟 retention_enabled 與 retention_period 可以起到替我們定期刪除資料的作用:
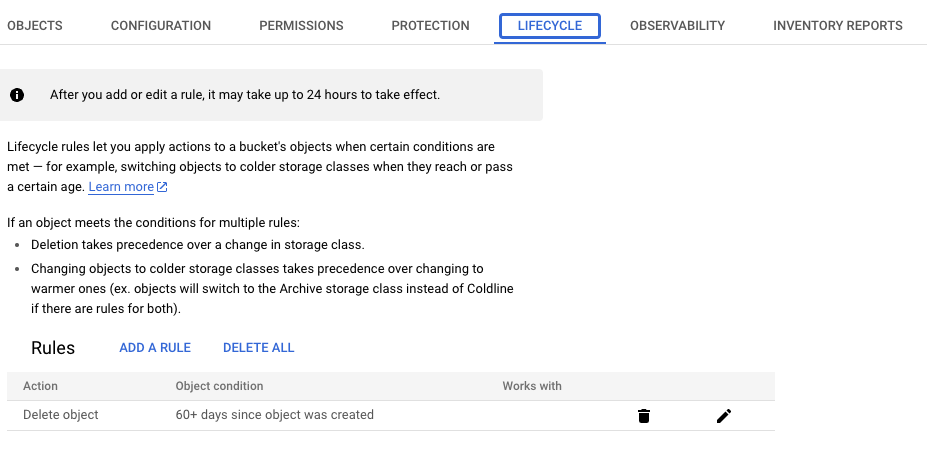
我們也可以使用 GCS 原生的 Lifecycle 來實現資料保留的操作:
Grafana Loki 的目標是向後兼容,在其開發過程中進行了許多內部更改,以促進更好、更高效的存儲 / 查詢。
從 Loki v2.8 開始,TSDB 就是官方唯一推薦索引儲存模式,相信很多人在這版本之前就已經在使用 Loki 了,幸虧 Grafana 團隊有遠見的設計,使得我們可以以最小的改動就從 boltdb 迭代到 TSDB。
schema_config:
  configs:
    # Old boltdb-shipper schema. Included in example for reference but does not need changing.
    - from: "2023-01-03" # <---- A date in the past
      index:
        period: 24h
        prefix: index_
      object_store: gcs
      schema: v12
      store: boltdb-shipper
    # New TSDB schema below
    - from: "2023-01-05" # <---- A date in the future
      index:
        period: 24h
        prefix: index_
      object_store: gcs
      schema: v12
      store: tsdb

storage_config:
  # Old boltdb-shipper configuration. Included in example for reference but does not need changing.
  boltdb_shipper:
    active_index_directory: /data/index
    build_per_tenant_index: true
    cache_location: /data/boltdb-cache
    shared_store: gcs
  # New tsdb-shipper configuration
  tsdb_shipper:
    active_index_directory: /data/tsdb-index
    cache_location: /data/tsdb-cache
    shared_store: gcs

query_scheduler:
  max_outstanding_requests_per_tenant: 32768

querier:
  max_concurrent: 16
從設定中我們可以了解到 schema_config 的設計精髓,聲明不同的時間使用對應的設定,讓我們可以同時向下無痛轉換模式,直到舊資料完全過期。
除了針對 Grafana Loki 本身的調整,我們也可以透過許多工具跟觀念來幫助我們提升 Loki 的上限。
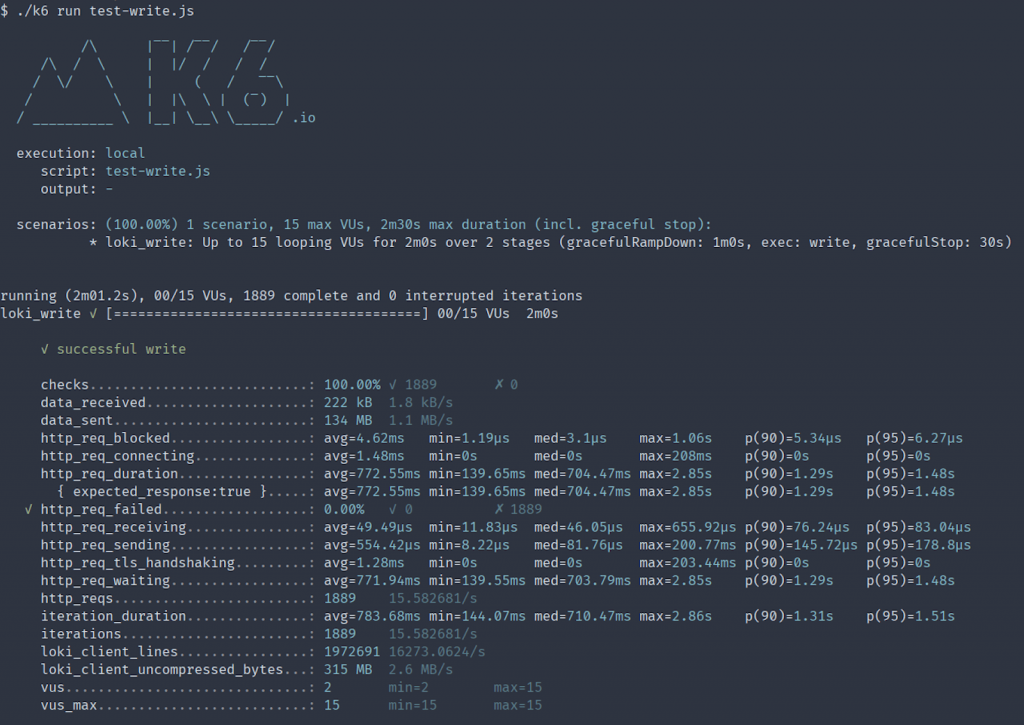
常常我們在部署一套服務時,我們都會想要知道多少的資源、多少的吞吐量是這套服務可以承受的,而大家在使用 Grafana Loki 的時候可能也會這樣子反問自己。剛好 Grafana 團隊旗下的壓力測試工具 Grafana K6 也替 Loki 量身定做了函式庫,使我們可以使用如下範例的簡單 JS 語法輕鬆測試我們的搭建出來的 Grafana Loki 日誌系統。
import loki from 'k6/x/loki';

const conf = loki.Config("http://localhost:3100");
const client = loki.Client(conf);

export default () => {
   let streams = randInt(2, 8);
   client.pushParameterized(streams, 1024*1024, 2*1024*1024);
};

function randomInt(min, max) {
  return Math.floor(Math.random() * (max - min + 1) + min);
};
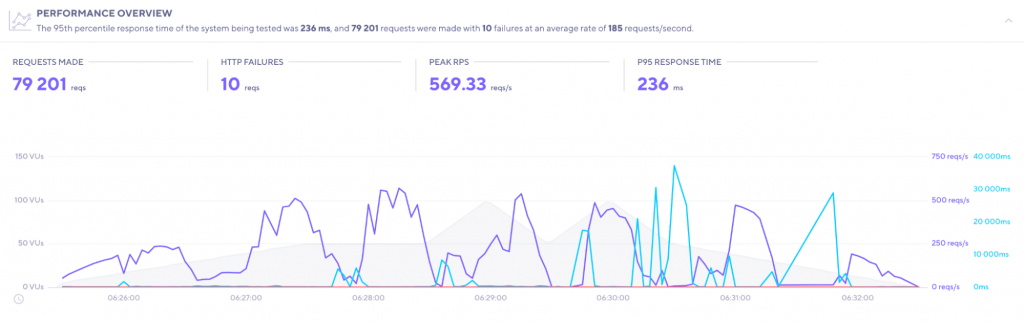
執行完畢時,可以產生出 Loki 相關壓力測試報告,適合我們打造我們自己的實際測試。
Grafana Loki 有個不同於大眾認知的特性,通常人們對於日誌或儲存的優化解決方案都是有關於所有的,這是非常常見的思考方式。但官方指出使用 Loki 時,需要忘記這些根深蒂固的觀念,並且以 Golang 高併發的特色來思考如何解決問題,也因此 Loki 的特點就是善於將查詢拆分成無數個小任務同時執行,實現短時間查詢大量日誌資料的操作。
以下為我們在設計標籤時要知道的幾點重要觀念:
簡單的重點在於,在 Grafana Loki 中的標籤應該越簡潔越好。
在本章中,我們將從讀寫、存儲,以及維運心法的角度,深入探討 Grafana Loki。這裡匯集了我在實際運環境下的慘痛經驗以及所踩過的坑,而某些特定內容由於打算單獨介紹,故在此並未詳盡展開。值得注意的是,Grafana Loki 仍在以驚人的速度不斷進化,我們必須持續學習以追趕其發展腳步。相信經由這幾個簡短章節的學習,我們能夠具備應對大多數生產環境的能力。接下來,我們將踏入追蹤指標的世界,一同探索 Grafana 團隊為我們精心打造的解決方案 Grafana Tempo。
相關程式碼同步收錄在:
https://github.com/MikeHsu0618/grafana-stack-in-kubernetes/tree/main/day24
References
Label best practices | Grafana Loki documentation
How to autoscale Grafana Loki queries using KEDA | Grafana Labs
All things logs: best practices for logging and Grafana Loki | Grafana Labs
https://github.com/grafana/grafana/issues/38665
Grafana Loki Configuration Nuances
Grafana Loki: performance optimization with Recording Rules, caching, and parallel queries
Loki components | Grafana Loki documentation
Caching | Grafana Loki documentation
Retention | Grafana Loki documentation
The essential config settings you should use so you won’t drop logs in Loki | Grafana Labs
Using k6 for load testing | Grafana Loki documentation
A quick guide to load testing Grafana Loki with Grafana k6 | Grafana Labs