前言:今天要練習如何使用ggplot2來繪製圖形,但因為能畫得實在是太多了,因此我只挑了三個出來講~~分別為直方圖、折線圖以及台灣地圖!只講一些基本的內容,所以圖可能會有點簡略><。如果內容有哪些錯誤的地方,請多多包涵~
正文開始-->
以下為一些ggplot2套件使用範例
程式碼:
#加載套件
library(ggplot2)
library(gapminder)
#繪製直方圖
ggplot(data = gapminder, aes(x = gdpPercap)) +
  geom_histogram(binwidth = 1000, fill = "blue", color = "black") +
  labs(title = "Distribution of GDP per Capita",
       x = "GDP per Capita",
       y = "Count") +
  theme_minimal()

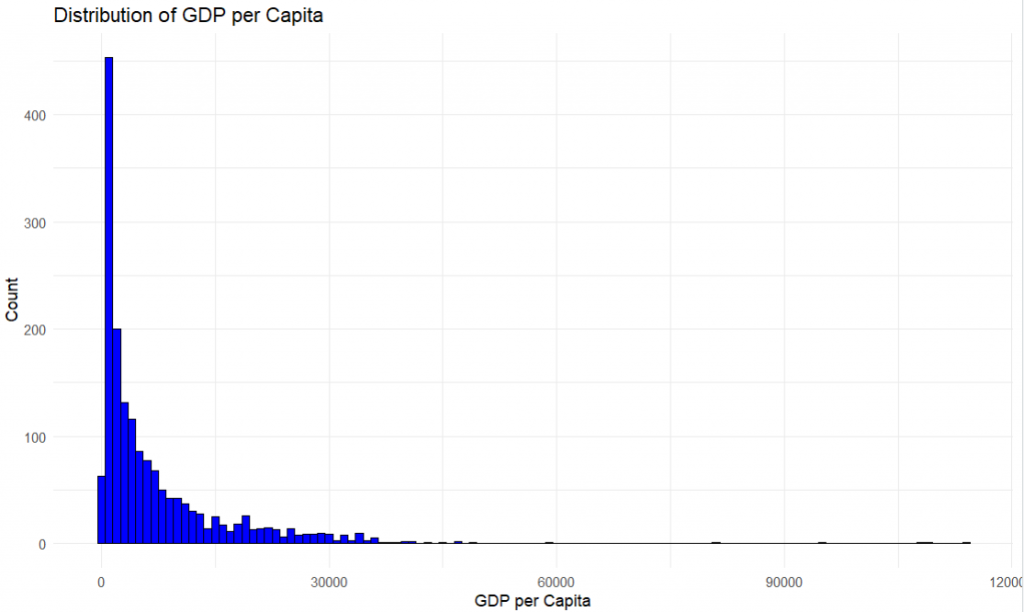
結果圖:
說明:
ggplot(data = gapminder, aes(x = gdpPercap)):指定 gapminder 數據集,並將人均 GDP (gdpPercap) 作為 x 軸數據。geom_histogram(binwidth = 1000, fill = "blue", color = "black"):創建直方圖,將每個柱狀區間的寬度設為 1000,柱狀體填充顏色為藍色,邊框為黑色。labs():添加標題以及 x 和 y 軸的標籤。theme_minimal():沒有背景的簡約主題。程式碼:
#繪製折線圖
#加載套件
library(ggplot2)
library(gapminder)
#繪製折線圖
ggplot(data = gapminder, aes(x = year, y = lifeExp, color = continent)) +
  geom_line() +
  labs(title = "Life Expectancy Over Time by Continent",
       x = "Year",
       y = "Life Expectancy") +
  theme_minimal()

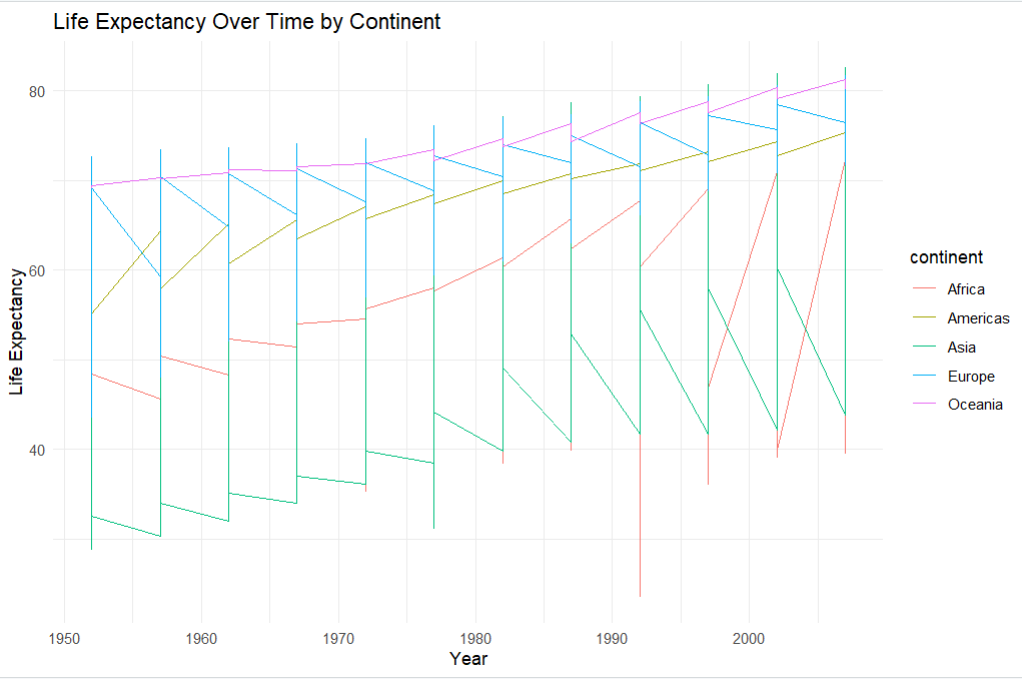
結果圖:
說明:
ggplot(data = gapminder, aes(x = year, y = lifeExp, color = continent))
geom_line():使用折線圖。labs():添加標題以及 x 和 y 軸的標籤。theme_minimal():沒有背景的簡約主題。程式碼:
#安裝加載套件
install.packages("maps")
library(ggplot2)
library(maps)
#使用maps包中的台灣地圖數據
taiwan_map <- map_data("world", region = "Taiwan")
#繪製台灣地圖
ggplot(data = taiwan_map, aes(x = long, y = lat, group = group)) +
  geom_polygon(fill = "lightblue", color = "black") +
  labs(title = "Map of Taiwan") +
  theme_minimal()

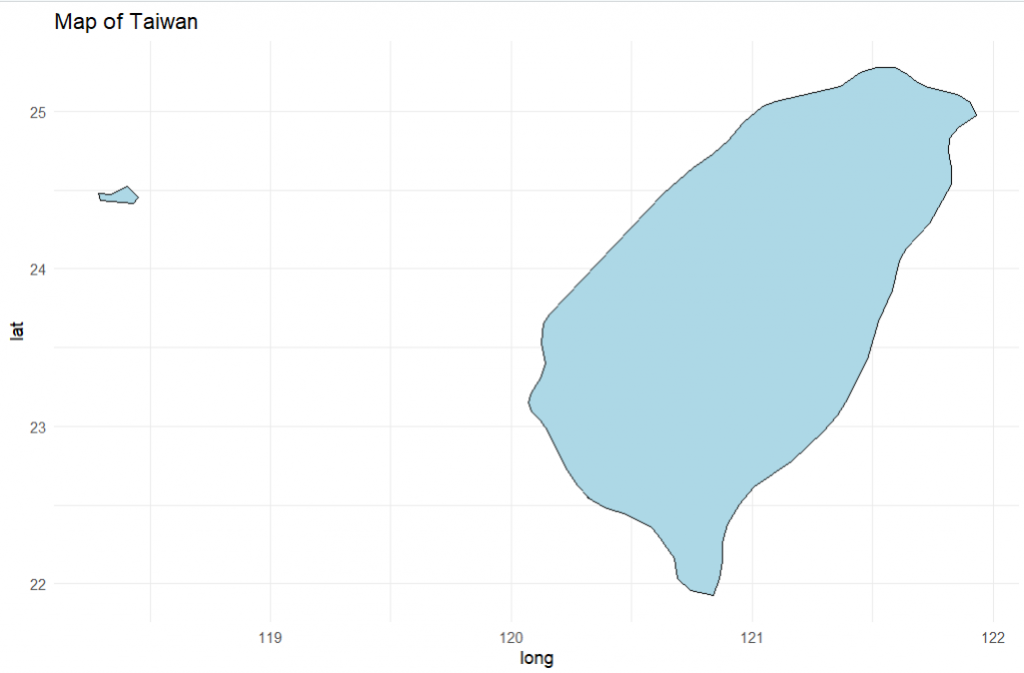
結果圖:
說明:
map_data("world", region = "Taiwan"):從 maps 套件中提取台灣的地理邊界數據。ggplot(data = taiwan_map, aes(x = long, y = lat, group = group)):使用 taiwan_map 資料集,其中 long 和 lat 是經緯度數據,group 用來表示多邊形的每個部分。geom_polygon(fill = "lightblue", color = "black"):使用 geom_polygon() 繪製地圖的邊界,多邊形的內部填充顏色為淺藍色,邊界顏色為黑色。labs():添加地圖的標題。theme_minimal():沒有背景的簡約主題。參考:
