由於前幾天的失利,所以現在只能開始按部就班的自己寫Env以及自己Reward策略來引導RL學習,而不能只像之前一樣當黑箱用,這樣發生問題很難找出原因。
由於要做實驗,所以想辦法找了簡單生成數據的辦法,來模擬我想要的數據走勢(如上升趨勢/下降趨勢/盤整),進而驗證自己設計的reward策略有哪些問題需要改善,等到模擬數據都能學得不錯以後,再開始升級難度,去使用真實的市場數據,並且把資料切割成train和trade數據集。
使用numpy以及pandas來生成cos或sin的波形數據,我寫了一個簡單的函數來生成不斷循環cosine週期的數據,start_date, end_date, freq決定生成多少筆模擬價格(主要就是close),透過amplitude, base_value, cycle_length來進一步調整生成出的數據。
這個極簡單的數據主要是剛開始寫的時候,驗證整個程式有沒有問題,是否有辦法學得起來;只要reward針對數據特性去寫,就能學得起來,如果學不起來,就使用生成的數據來Debug看問題在哪,如何調整。
import pandas
import numpy as np
import matplotlib.pyplot as plt
import plotly.graph_objects as go
def generate_cosine_df(start_date, end_date, freq, amplitude, base_value, cycle_length):
    dates = pd.date_range(start=start_date, end=end_date, freq=freq)
    x = np.linspace(0, 2 * np.pi * len(dates) / cycle_length, len(dates))
    prices = amplitude * np.cos(x) + (base_value + amplitude)
    df = pd.DataFrame({
        'timestamp': dates,
        'open': prices,
        'high': prices * 1.001,
        'low': prices * 0.998,
        'close': prices,
        'volume': np.random.randint(1000, 10000, size=len(dates))
    })

    # 添加ticker欄位
    df['ticker'] = "BTCUSD"

    # 確保timestamp轉換為UTC格式
    df['timestamp'] = pd.to_datetime(df['timestamp'], utc=True)

    return df
這個就需要參考別人的專案了,我這邊是使用了PriceGenerator - Github提供的功能,來生成較為逼真的隨機價格數據;用這個生成的缺點就是價格是純隨機的,不像一些用NN去生成的模擬價格可能可以學到一些金融市場的特性,這個生成的數據就真的是根據參數去生成,只是看起來逼真。
由於希望簡單點讓一開始RL學習的難度不要太大,所以很多波動數值我都盡量調小,生成的‵盤整‵數據結果的‵close`價格畫出來大概長這樣,可以視需求調整: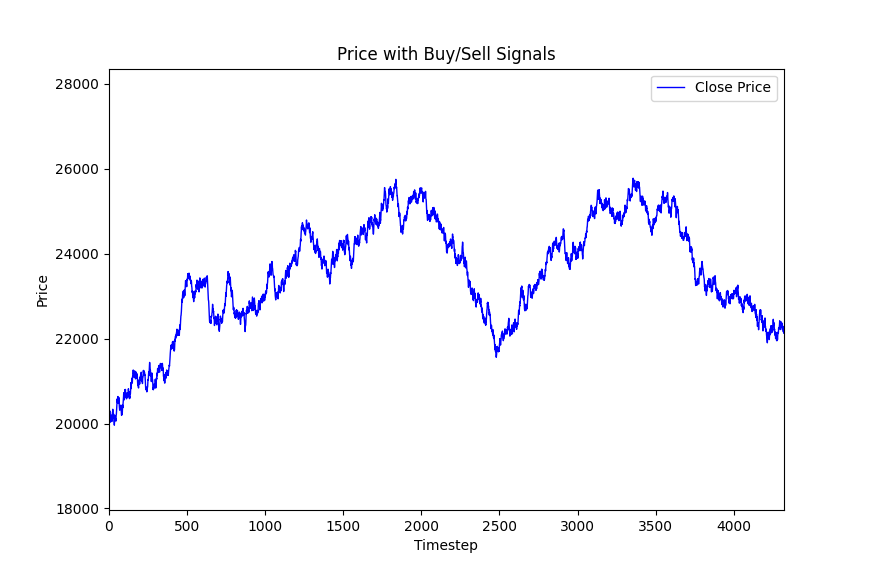
以下是我用來生成的程式碼,加入了input(...)來互動式生成圖片,如果不滿意生成的圖就打叉,然後在cmd按Enter,直到生成滿意的數據圖後再按S存檔。
def generate_btcusd_df(start_date, end_date, ticker, init_p=14000, max_p=16000, min_p=13800, max_ppeak=None, max_pstep=None, trend='up', path='gen_prices.csv'):
    from pricegenerator.PriceGenerator import PriceGenerator, uLogger
    from datetime import datetime, timedelta
    import os
    if path is not None and os.path.exists(path):
        res = pd.read_csv(path)
        if res is not None and len(res) > 0:
            return res

    while True:
        # Disable logging:
        uLogger.setLevel(0)

        # --- Initialize an instance of the generator class and set some parameters:
        priceModel = PriceGenerator()
        priceModel.precision = 4  # how many decimal places should be in generated prices
        priceModel.ticker = ticker  # random name (ticker) of generated prices
        priceModel._chartTitle = ""  # chart title, usually generated automatically

        priceModel.timeframe = timedelta(minutes=15)  # time interval between generated candles, 1 hour by default
        priceModel.timeStart = pd.to_datetime(start_date)  # from what date to start generating candles, by default from the current time
        priceModel.horizon = int(round((pd.to_datetime(end_date) - pd.to_datetime(start_date)) / timedelta(minutes=15))) + 1

        priceModel.maxClose = max_p  # the highest candlestick closing price in the entire price chain
                                    # by default, it is generated randomly in the interval (70, 90), it is similar to the current prices of USDRUB
        priceModel.minClose = min_p  # the lowest candlestick closing price in the entire price chain
                                    # by default, it is generated randomly in the interval (60, 70), it is similar to the current prices of USDRUB
        priceModel.initClose = init_p  # if a price is specified, it will be the closing price like the "previous" candlestick, and at the same time the opening price of the first candlestick in the generated chain
                                    # None by default means that the opening price of the first candle will be generated randomly in the interval (minClose, maxClose)
        if max_ppeak is None: ### low, high部份"針"的最大限制

            priceModel.maxOutlier = (max_p-min_p)/15.0  # The maximum value for the price outlier of the "tails" of the candles.
                                                        # None by default means that outliers will be no more than (maxClose - minClose) / 10
        else:
            priceModel.maxOutlier = max_ppeak

        if max_pstep is None:
            priceModel.maxCandleBody = init_p/(20*10)   # maximum value for the size of candlestick bodies abs(open - close)
                                                        # None by default means that the candlestick body can be no more than 90% of the outlier size: maxOutlier * 90%
        else:
            priceModel.maxCandleBody = max_pstep

        if type(trend) == str:
            #
            '''
            # price fluctuations between close prices of the first and last candlesticks defining the trend. “NO trend” if the difference is less than this value, by default ± 0.005 or ± 0.5%
            priceModel.trendDeviation = 0.005

            # probability that the next generated candlestick will be up, 50% by default
            priceModel.upCandlesProb = 0.46
            '''
            if trend == 'up':
                priceModel.trendDeviation = 0.005
                priceModel.upCandlesProb = 0.51
            elif trend == 'down':
                priceModel.trendDeviation = 0.005
                priceModel.upCandlesProb = 0.49
            else:
                priceModel.trendDeviation = 0.005
                priceModel.upCandlesProb = 0.5
        priceModel.maxVolume = 40000  # the maximum trading volume for one candle, by default it is taken randomly from the interval (0, 100000)

        # the probability that the next generated candlestick will have a price "outlier", 3% by default
        priceModel.outliersProb = 0.01

        # relative difference between two points of ZigZag indicator, default is 0.03
        priceModel.zigzag = 0.03

        # Prices have not yet been generated and not loaded, let's check this:
        # print("Current prices:\n{}".format(priceModel.prices))
        df = priceModel.pricimport gymnasium as gym

if __name__ == "__main__":
    DATA_START_DATE = "2024-03-01"
    DATA_END_DATE = "2024-04-15"
    df = generate_btcusd_df(DATA_START_DATE, DATA_END_DATE, ticker="BTCUSD", init_p=20000, max_p=77000, min_p=15000, trend='up')
    plot_price_with_signals(df)
Reward在設計我的自訂交易環境的獎勵函數時,我的目標是激勵RL實現資產增長,同時懲罰不當或無效的操作。具體邏輯如下:
資產計算:資產(asset)是通過將現金餘額(balance)與持倉價值(position × 當前價格)相加得到的。具體公式為 asset = balance + position * price。這種計算方式全面反映了代理人在當前步驟的總資產狀況,既考慮了現金的流動性,也考慮了持有資產的潛在增值。
資產增長獎勵:獎勵基於資產價值的對數增長計算,原本是直接簡單暴力的使用(asset-prev_asset)/init_asset的方式計算reward,不過後來,參考別人的文章後改成使用自然對數 (np.log(asset/prev_asset)) 看起來比較高大上;總之是促進持續的資產增長。這鼓勵代理人採取能夠穩步增加總資產的行動策略。
無效操作懲罰:若代理人執行無效的買賣操作(如資金不足買入或持倉不足賣出),則會根據初始資金的1%乘以無效操作次數來扣減獎勵 (invalid_action_penalty = -self.initial_balance * 0.01 * invalid_action_count)。這一設計有效抑制了代理人進行不可行的交易行為,促使其更加謹慎和策略性地操作。
獎勵規範化:最終的獎勵值是資產增長獎勵與無效操作懲罰的綜合,並將懲罰部分按初始資金進行規範化 (reward = np.log(asset/prev_asset) + (invalid_action_penalty / self.initial_balance))。這確保了獎勵函數在不同規模的初始資金下依然具有一致性和公平性。
現在這套reward機制是會使訓練出來的RL消極怠工;針對上升趨勢數據: 一開始買入以後就一直放著,反正‵未實現損益‵也會反應在asset中,根本不需要賣出;針對下降趨勢數據和盤整數據:幾乎沒啥有效動作;所以目前還沒啥卵用,需要繼續根據目前碰到的狀況,繼續調整reward。
目前看起來我是要開天窗了,只好之後完成以後再補了~中間亂發散太久...Orz
class RewardCalculator:
    def __init__(self, initial_balance=1000000):
        self.initial_balance = initial_balance # 初始余额

    def calculate_reward(self, prev_info: RewardInfo, info: RewardInfo, invalid_action_count=0):

        prev_asset = prev_info.balance + prev_info.position * prev_info.price
        asset = info.balance + info.position * info.price

        # 有現金不買的懲罰

        # 無效操作懲罰
        invalid_action_penalty = 0
        if invalid_action_count > 0:
            invalid_action_penalty = -self.initial_balance * 0.01 * invalid_action_count

        # 奖励规范化
        reward = np.log(asset/prev_asset) + (invalid_action_penalty / self.initial_balance)

        # 返回奖励和其他信息
        return reward, {
            'balance': info.balance,
            'position': info.position,
            'price': info.price,
            'asset': asset,
        }
RL的效果import numpy as np
import pandas as pd
from stable_baselines3 import PPO
from PolygonIO.PolygonIODownloader import PolygonIODownloader
from tqdm import tqdm
import os
from stable_baselines3.common.utils import get_linear_fn
from cwzutils import *
from cwzstrategy import *
def main():
from finrl.meta.preprocessor.preprocessors import data_split
DATA_START_DATE = "2017-01-01"
DATA_END_DATE = "2024-10-09"
TRAIN_START_DATE = "2024-03-01"
TRAIN_END_DATE = "2024-04-15"
TRADE_START_DATE = "2024-03-01"
TRADE_END_DATE = "2024-04-15"
TRAINED_MODEL_DIR = f"BTCUSD_15_minute_{TRAIN_START_DATE}_{TRAIN_END_DATE}_ForexEnv"
TRAINED_MODEL_DIR = os.path.join("trained_models", TRAINED_MODEL_DIR)
os.makedirs(TRAINED_MODEL_DIR, exist_ok=True)
# 獲取數據並處理
df_ohlcv = PolygonIODownloader().fetch_ohlcv(
["X:BTCUSD"], DATA_START_DATE, DATA_END_DATE, "minute", 15
)
# df_ohlcv = generate_cosine_df(DATA_START_DATE, DATA_END_DATE, freq='15T', amplitude=30000, base_value=45000, cycle_length=10000)
# df_ohlcv = generate_btcusd_df(DATA_START_DATE, DATA_END_DATE, ticker="BTCUSD", init_p=30000, max_p=46000, min_p=28000, trend='up')
df_ohlcv = df_ohlcv.rename(columns={"timestamp": "date", "ticker": "tic"})
df = df_ohlcv.sort_values(["date", "tic"]).reset_index(drop=True)
# df = extract_custom_features(df)
df = df.rename(
columns={
"close": "Close", # 確認 'close' 被正確映射為 'Close'
"high": "High",
"low": "Low",
"open": "Open",
"volume": "Volume", # 確認 'volume' 被正確映射
}
)
train = data_split(df, TRAIN_START_DATE, TRAIN_END_DATE)
trade = data_split(df, TRADE_START_DATE, TRADE_END_DATE)
df = trade
df = generate_btcusd_df(
TRADE_START_DATE, TRADE_END_DATE, ticker="BTCUSD",
init_p=40000, max_p=77000, min_p=15000, trend='', path='btcusd_15min_notrend_genereated.csv')
print(f"Training Data Length: {len(train)}")
print(f"Trading Data Length: {len(trade)}")
# 使用自訂的交易環境
window_size = 96 # 設定適當的 window size
env = CustomTradingEnv(df=df, window_size=window_size)
# 初始化並訓練 A2C 模型
# Define a learning rate schedule that decays from 0.0003 to 0.0001
learning_rate_schedule = get_linear_fn(start=0.0005, end=0.0001, end_fraction=0.9)
model = PPO("MlpPolicy", env, verbose=1, learning_rate=3e-4) # , ent_coef=0.01)
# 將這個回調傳遞給 PPO 的 learn 函式
callback = CustomLogCallback()
model.learn(total_timesteps=100000, callback=callback)
# 回測過程
actions = [None] * len(df)
obs, _ = env.reset()
for step in tqdm(range(len(df)), desc="Backtesting Progress"):
action, _states = model.predict(obs)
obs, reward, done, truncated, info = env.step(action)
actions[step] = action
if action != 0:
env.render()
if done or truncated:
break
env.render()
plot_price_with_signals(df, actions)
input("Press Enter to exit...")
if __name__ == "__main__":
main()


 iThome鐵人賽