雖然快取能加速查詢,但如果命中率太低幫助就不大,由於 INSERT 也會將資料放在快取,查詢剛建立的資料一定會命中快取,因此理想的快取命中率要在 98% 左右,如果掉到 95% 以下效能就會有明顯下降了!
執行 show engine innodb status 可看到 InnoDB 運作狀況,其中 BUFFER POOL AND MEMORY 段落有 Buffer Pool 相關數據,該段落裡的 Buffer pool hit rate 1000 / 1000 代表一千次查詢中有幾次有命中快取。
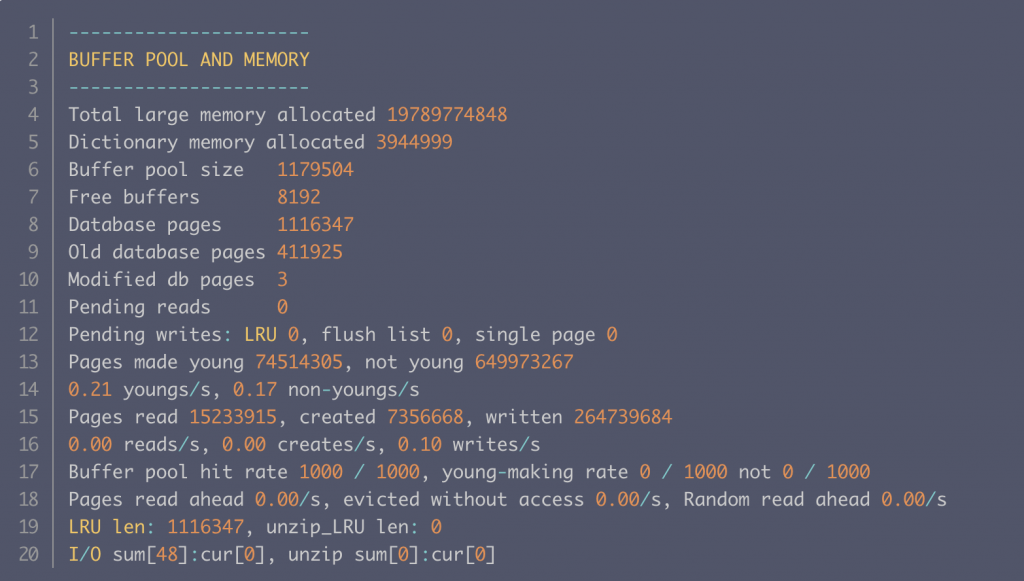
(圖片來源:https://cloud.tencent.com/developer/article/1424670)
當 hit rate 下降時,reads/s (每秒平均有多少查詢需要 I/O) 通常會上升,此時可先檢查 new sublist LRU 中有無資料:
Free Buffer : 可用的空間,單位為 pageDatabase pages : LRU 全部頁數(不含 free)Old database pages : old sublist 頁數Database pages − Old database pages
如果 Free Buffer 很大且 new sublists page 不多,代表 old sublist 不斷刷新快取,page 來不及進到 new sublist 就被淘汰了,此時資料庫大概率在執行全表掃描或大範圍的查詢。
但如果 new sublist page 很多, hit rates 卻下降且 reads/s 升高,可在檢查下面數據:
young-making rate : 1000 次查詢中有幾次在 old sublist 命中,且把 Page 移到 new sublistnot young-making rate : 1000 次查詢中有幾次在 old sublist 命中,但沒把 Page 移到 new sublist如果 young-making rate 低 not young-making rate 高,此時查詢只走進 old sublist,new sublist 有資料但命中率不高,代表查詢模式有變,熱資料需要被更新,但是 old sublist 卻不斷刷新快取,導致新熱點 page 進不到 new sublist。
解決上述問題要修復全表掃描,或者調整 innodb_old_blocks_pct 參數,把 old sublist 調大,降低 page 被淘汰的機率,提高 page 被移到 new sublist 機率。
該現象代表有大量資料進入 new sublist,但空間不夠資料一直淘汰掉,此時在升級記憶體空間前,可檢查 Buffer Pool 都塞了什麼資料。
information_schema DB 中的 innodb_buffer_page_lru Table 紀錄了快取資料,執行 select Table_name, Index_name, Data_size from information_schema.innodb_buffer_page_lru where table_name like "{db_name}.%" 可看有哪些 Index 被放進快取中,例如:
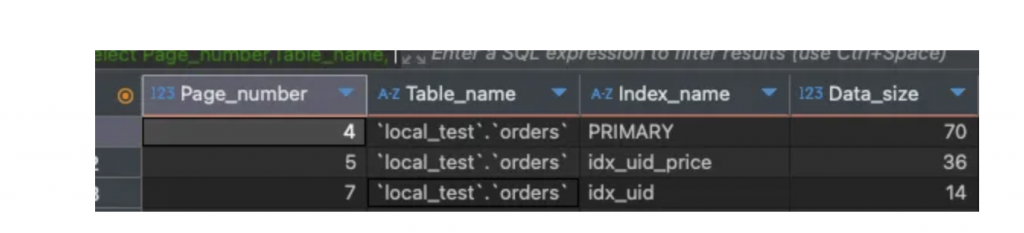
(作者製圖)
上圖可發現,有三個 Index Tree 在快取,由於 insert 資料時需要更新所有 index 因此會載入多 index tree 的 page 到記憶體中。
然而 idx_uid_price 跟 idx_uid 有同等的效果, SELECT * FROM orders WHERE user_id = ? 會命中 idx_uid_price 或者 idx_uid Index,因此可刪除 idx_uid 減省空間。
此外還可發現 primary Index Tree 的 data size 比其他 index tree 大 ,因此 SELECT * 不僅查詢較慢還會載入較多資料到記憶體,而 index 太多時,也會在 insert 時塞入更多 index tree 到 Buffer Pool 中。
因此可先從優化查詢跟減少 index 數量著手,記憶體還是不夠的話,我們還可看 Buffer Pool 中的 Page Type,執行 **select** **DISTINCT**(PAGE_TYPE) **from** information_schema.innodb_buffer_page_lru
看是否有其他系統資料佔用空間。
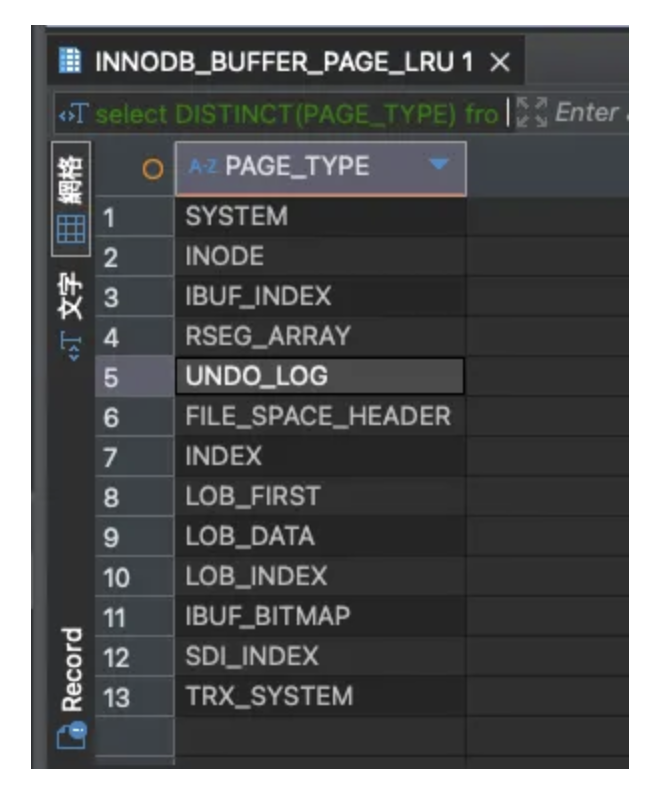
(作者製圖)
查看後,會發現除了 index tree 外還有其他系統資料,其中可能會佔用大量空間的是 Undo Log,Undo Log 是實作 Isolation & Atomicity 功能的結構 (下一章節會說明),若 Transaction 執行太久不 Commit,會造成 Undo Log 資料變大,可在 show engine innodb status 的 **Transaction** 段落中查 History list length,該值代表還沒被清除的 Undo Log 數量,若該值很大可透過下面 SQL 查詢執行最久的 Transaction thread ID,然後透過 SHOW PROCESSLIST 找到執行的 Process 並直接 Kill 掉。
SELECT trx_id,
       trx_started,
       trx_mysql_thread_id,
       trx_query,
       trx_rows_modified,
       trx_state,
       trx_tables_in_use,
       trx_rows_locked,
       trx_isolation_level
FROM information_schema.innodb_trx
ORDER BY trx_started ASC
LIMIT 5;
Free Pages 接近 0 & Page Types 大多為 Index Page
代表空間有效被利用
young-making rate & not young-making rate 長時間接近 0
代表大部分查詢都有命中 new sublist,查詢模式穩定
hit rate 接近 100% 且 reads/s 不多
代表快取命中率高,I/O 次數不多,查詢普遍都很快

