前面兩天我們介紹了 eBPF 的追蹤機制,以及如何使用 bpftrace 快速收集 kernel 和 user space 的可觀測性資料。今天我們要完成系列文的最後一塊拼圖,將 eBPF 收集到的資料轉換成 OTLP format,將資料串接到 OpenTelemetry 當中。
OpenTelemetry 提供了一個官方工具 OpenTelemetry eBPF Instrumentation (OBI),可以自動使用 eBPF 追蹤應用程式,並直接輸出 OTLP 格式。
OBI 讓我們不需要修改應用程式的程式碼、也不需要重新編譯,便可以自動使用 eBPF 追蹤應用程式,此外,它還額外支援:
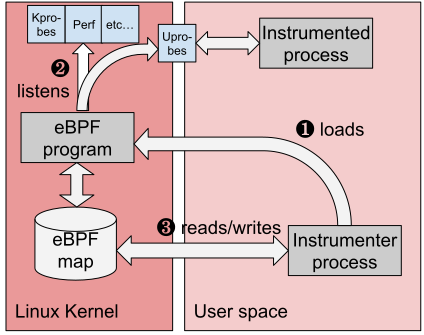
從以上這張圖我們可以理解整個 OBI 的運作流程:
可以透過以下指令檢查 kernel 版本:
uname -r
我們直接使用 OpenTelemetry 官方提供的範例。使用 docker container 部署 OBI 以及被追蹤的應用程式服務:
version: '3.8'

services:
  # Service to instrument. Change it to any
  # other container that you want to instrument.
  goblog:
    image: mariomac/goblog:dev
    ports:
      # Exposes port 18843, forwarding it to container port 8443
      - '18443:8443'

  autoinstrumenter:
    image: docker.io/otel/ebpf-instrument:main
    pid: 'host'
    privileged: true
    environment:
      OTEL_EBPF_TRACE_PRINTER: text
      OTEL_EBPF_OPEN_PORT: 8443
在這邊會需要設定一些參數:
OTEL_EBPF_OPEN_PORT=8080: 告訴 OBI 追蹤 port 8080 的流量 (http server 的 port)OTEL_EBPF_TRACE_PRINTER=text: 將 traces 直接印到 console (方便測試)pid: 'host': 讓 OBI 能看到 host 上的所有 processprivileged: true: 賦予容器權限來載入 eBPF 程式另外開一個終端機發送 http 請求:
curl http://localhost:18443/
發送成功後就會收到 server 回傳的 response
Client sent an HTTP request to an HTTPS server.
接著,再回到 OBI container 的 log,就會收到剛剛那筆 request 的trace。
goblog-1 | time=2025-10-12T16:24:59.444Z level=INFO msg="http: TLS handshake error from 192.168.107.1:56018: client sent an HTTP request to an HTTPS server"
不過實際使用時,我們不會把 traces 印到 console,而是送到 OTEL Collector。我們需要修改一下 OBI 的環境變數:
  autoinstrumenter:
    image: docker.io/otel/ebpf-instrument:main
    pid: 'host'
    privileged: true
    environment:
      OTEL_EXPORTER_OTLP_ENDPOINT: "http://host.docker.internal:4317"
      OTEL_SERVICE_NAME: "goblog-app"
      OTEL_EBPF_OPEN_PORT: 18443
在這邊新增了兩個參數:
OTEL_EXPORTER_OTLP_ENDPOINT: 指向 OTEL Collector 的 gRPC endpoint。host.docker.internal 是 Docker 訪問 host 的特殊 hostnameOTEL_SERVICE_NAME: 在 traces 中標記這是哪個服務使用我們之前在 Day 7 的 OpenTelemetry Collector 設定檔並啟動 container:
# otel-config.yaml
receivers:
  otlp:
    protocols:
      grpc:
        endpoint: 0.0.0.0:4317

processors:
  batch:
    timeout: 1s

exporters:
  debug:
    verbosity: detailed

service:
  pipelines:
    traces:
      receivers: [otlp]
      processors: [batch]
      exporters: [debug]
嘗試發送 5 個測試請求
for i in {1..5}; do
  curl -k https://localhost:18443/
  sleep 1
done
接著,我們直接查詢 otel collector 的 log,就會看到完整的 trace 資訊了。
InstrumentationScope
Span #0
    Trace ID       : 747400e4b85cc130801dd6db55af2bdd
    Parent ID      : e6885733f18b08b4
    ID             : 1404b999b815e325
    Name           : in queue
    Kind           : Internal
    Start time     : 2025-10-12 16:39:43.370514689 +0000 UTC
    End time       : 2025-10-12 16:39:43.370530981 +0000 UTC
    Status code    : Unset
    Status message :
Span #1
    Trace ID       : 747400e4b85cc130801dd6db55af2bdd
    Parent ID      : e6885733f18b08b4
    ID             : a3ad71d0a726bda8
    Name           : processing
    Kind           : Internal
    Start time     : 2025-10-12 16:39:43.370530981 +0000 UTC
    End time       : 2025-10-12 16:39:43.370567189 +0000 UTC
    Status code    : Unset
    Status message :
Span #2
    Trace ID       : 747400e4b85cc130801dd6db55af2bdd
    Parent ID      :
    ID             : e6885733f18b08b4
    Name           : GET /
    Kind           : Server
    Start time     : 2025-10-12 16:39:43.370514689 +0000 UTC
    End time       : 2025-10-12 16:39:43.370567189 +0000 UTC
    Status code    : Unset
    Status message :
今天我們學會了如何使用 OpenTelemetry eBPF Instrumentation (OBI) 將 eBPF 收集的資料轉換成 OTLP format。透過 OBI,我們可以在不修改程式碼的情況下,自動透過 eBPF 收集 HTTP/HTTPS/gRPC 等網路流量,並且可以將這些資料透過 OTLP 的統一格式,一起整合到 OpenTelemetry Collector 當中。
這其實也實現了 observability 2.0 的 single source of truth 的精神,並且透過 OpenTelmetry 的 auto instrument,我們不必再自行安裝 eBPF 相關的套件、自行撰寫掛載的程式碼並編譯,同時對於雲端原生的服務也有相當好的整合性。
OpenTelemetry eBPF Instrumentation


 iThome鐵人賽