不知不覺鐵人賽已經進入倒數完結的階段,我們花了很多篇幅討論如何建立 Data Lakehouse 的架構、如何建立 data pipeline 來將 OTLP 資料寫入 data lakehouse。
當資料存好後,團隊要如何實際看到這些可觀測性資料呢?今天我們要介紹如何用 Grafana 串接 Athena,將儲存在 S3 Table 的資料視覺化成 Dashboard。
Grafana 是目前業界最常用的可觀測性視覺化工具,支援多種資料源(Prometheus、ClickHouse、SQL databases 等)。而 Athena 是 AWS 提供的 serverless 查詢引擎,原生支援 Iceberg Table format,不需要額外的 compute cluster,按查詢掃描的資料量計費。
使用這樣的查詢引擎和視覺化工具的組合,就有以下優勢:
接下來,讓我們來看看要如何讓 Grafana 串接 Athena,成功讀取 S3 Table 中的資料吧。
Grafana 官方提供了 Athena plugin。如果你是用 Docker 執行 Grafana,可以在啟動時安裝:
docker run -d \
  -p 3000:3000 \
  -e "GF_INSTALL_PLUGINS=grafana-athena-datasource" \
  --name=grafana \
  grafana/grafana
安裝後在 Grafana UI 中前往 Connections → Add new connection,搜尋 "Athena" 就能看到這個 plugin。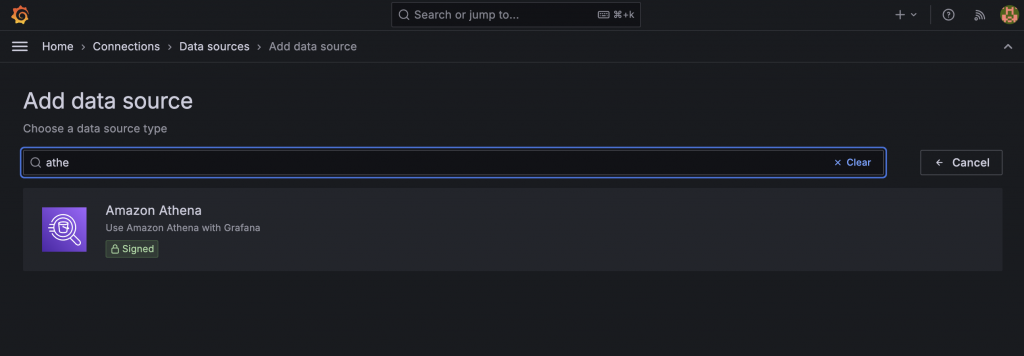
Grafana 需要有權限查詢 Athena 和讀取 S3。所以,在這邊我們會建立一個專門的 IAM User grafana-athena-user,附加以下的 policy,賦予 Grafana 使用 Athena 查詢 S3 Table 的權限。
{
    "Version": "2012-10-17",
    "Statement": [
        {
            "Effect": "Allow",
            "Action": [
                "athena:StartQueryExecution",
                "athena:GetQueryExecution",
                "athena:GetQueryResults",
                "athena:StopQueryExecution",
                "athena:GetWorkGroup",
                "athena:ListWorkGroups",
                "athena:ListDataCatalogs",
                "athena:ListDatabases"
            ],
            "Resource": "*"
        },
        {
            "Effect": "Allow",
            "Action": [
                "s3:GetBucketLocation",
                "s3:GetObject",
                "s3:ListBucket",
                "s3:PutObject"
            ],
            "Resource": [
                "arn:aws:s3:::your-athena-query-result-bucket",
                "arn:aws:s3:::your-athena-query-result-bucket/*"
            ]
        },
        {
            "Effect": "Allow",
            "Action": [
                "glue:GetDatabase",
                "glue:GetDatabases",
                "glue:GetTable",
                "glue:GetTables",
                "glue:GetPartition",
                "glue:GetPartitions"
            ],
            "Resource": [
                "arn:aws:glue:*:*:catalog",
                "arn:aws:glue:*:*:database/*",
                "arn:aws:glue:*:*:table/*/*"
            ]
        }
    ]
}
IAM User 創建完畢後,接著產生一把 Access key,稍後會需要將這把 key 給 Grafana 做使用。
設定完 Athena 後,就可以回到 Grafana 新增 Athena data source。
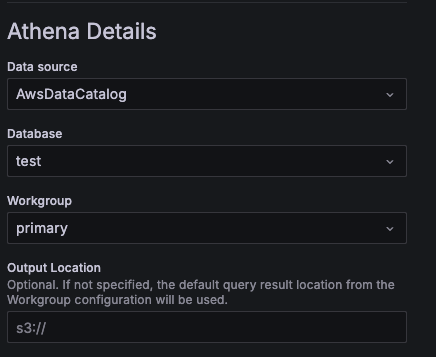
目前撰寫文章的時間點,其最新版本(v11.4.0) Grafana 的 UI 尚不支援顯示 S3 Table 的 catalog。這是因為查詢 S3 Table catalog 和 Glue catalog 的 API 不同導致。
因此,在步驟三要去設定 Data source 的時候,其實我們是沒有辦法在 Database 那個欄位找到 我們在 S3 Table bucket 上建立的 database(在 S3 Table 稱作 namespace)。但是我們可以在設定完 data source 後,創建 dashboard 時進行手動更新。
作法是在 dashboard 的 JSON 檔中,找到 target,接著把裡面的欄位都改成你的 S3 Table 的設定,範例如下:
"targets": [
    {
        "connectionArgs": {
        "catalog": "s3tablescatalog/opentelemetry-man-poc-table-bucket",
        "database": "opentelemetry_man_namespace",
        "region": "ap-northeast-1",
        "resultReuseEnabled": false,
        "resultReuseMaxAgeInMinutes": 60
        },
        "datasource": {
        "type": "grafana-athena-datasource",
        "uid": "aeyu63yvtzrpce"
        },
        "format": 1,
        "rawSQL": "SELECT * FROM opentelemetry_man_metrics_gauge ",
        "refId": "A"
    }
],
手動將 catalog、database這兩個欄位改成 S3 Table之設定,儲存之後就可以看到 UI 正常顯示,也能夠成功查詢 S3 Table 上面的資料了。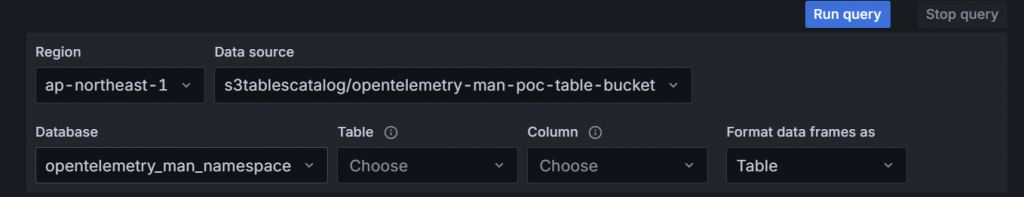
今天我們完成了 Observability 2.0 架構的最後一塊拼圖:視覺化。從 Day 1 的架構設計、Day 4 的 Data Lakehouse 建置、到 Day 22-24 的 OTLP 資料轉換,最後,我們就能透過 Grafana 將這些資料呈現出來。
透過 Grafana + Athena 的組合,我們不需要維運額外的查詢引擎,就能直接查詢 S3 Table 中的可觀測性資料。雖然目前 Grafana 對 S3 Table 的支援還需要手動調整 JSON 設定,但相信隨著 S3 Table 的普及,未來 UI 的整合會更加完善。
Apache Iceberg - Iceberg AWS Integrations
AWS Documentation - What is Amazon Athena?
Grafana Issue - Plugin does not see S3Tables Table Bucket catalogs as shown in AWS Athena UI
Grafana Plugin - Amazon Athena


 iThome鐵人賽