Ext js 也提供了多樣的圖表資訊,來豐富整個資料呈現的方式,透過圖表比單單就文字/數字的判讀來得容易許多。
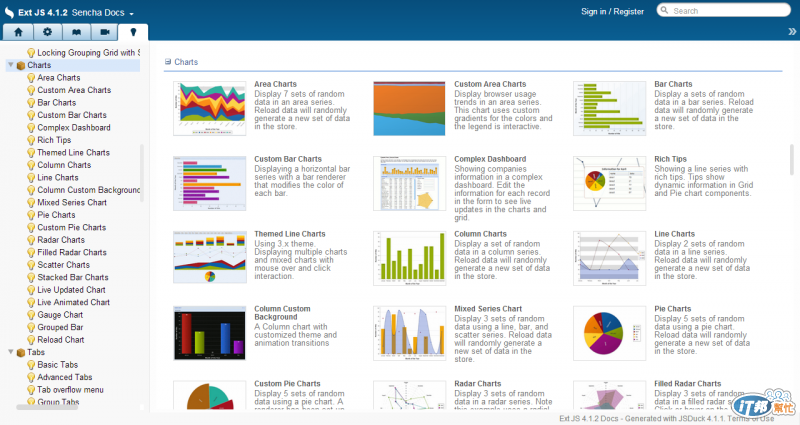
圖1:Ext js Charts(資料來源:Sencha 網站)
對於太過於複雜的圖形,短期內要搞懂可能得花費很多時間,於是 James 選擇了較常使用的 Line Chart 作為圖形展示的方式。
與 Grid 的資料來源一樣,James 透過 qryEISbySQL.aspx 來取得所需的 JSON Data,在這邊要將過去的實際銷售與 PM 銷售預測及 Sales 銷售預測進行比較。圖形的構成要件主要有幾個部分:Legend(圖例),Axes(座標軸):Y軸(通常為數字)、X軸(通常為分類),Series(資料序列):指定 Y 軸資料來源欄位,X 軸資料來源欄位以及圖形顯示的類型(如:Line),只要將相關設定的關係搞懂,產生圖形其實比產生 Grid 要來的簡單許多。
grid_Fcst_HitRate.js
var store1 = new Ext.data.JsonStore({
    // store configs
    autoDestroy: true,
    storeId: 'Resale',
    proxy: {
      type: 'ajax',
      url: 'BusinessObject/qryEISbySQL.aspx?sql=select * from PO_fcst_hitrate2 where part_id=\'' + part_id + '\' and yymm=\'' + lsq_6 + '\' and SLIP_NO=\'' +SLIP_NO+'\' and SLIP_DATE=\''+SLIP_DATE+'\'',
      reader: {
        type: 'json'
      }
    },

    //alternatively, a Ext.data.Model name can be given (see Ext.data.Store for an example)
    fields: [
   { name: 'yymm', type: 'string' },
   { name: '實際銷售', type: 'float' },
   { name: 'PM預測', type: 'float' },
   { name: 'Sales預測', type: 'float' }
    ]
  });

var chart = Ext.create('Ext.chart.Chart' , {
    xtype: 'chart',
    style: 'background:#fff',
    animate: true,
    store: store1,
    shadow: true,
    theme: 'Category1',
    legend: {
      position: 'right'
    },
    axes: [{
      type: 'Numeric',
      minimum: 0,
      position: 'left',
      fields: [ '實際銷售' , 'PM預測', 'Sales預測'],
      title: '',
      minorTickSteps: 1,
      grid: {
        odd: {
          opacity: 1,
          fill: '#ddd',
          stroke: '#bbb',
          'stroke-width': 0.5
        }
      }
    }, {
      type: 'Category',
      position: 'bottom',
      fields: [ 'yymm'],
      title: ''
    }],
    series: [{
      type: 'line',
      highlight: {
        size: 7,
        radius: 7
      },
      axis: 'left',
      smooth: true,
      fill: false,
      xField: 'yymm',
      yField: '實際銷售' ,
      markerConfig: {
        type: 'cross',
        size: 4,
        radius: 4,
        'stroke-width': 0
      }
    }, {
      type: 'line',
      highlight: {
        size: 7,
        radius: 7
      },
      axis: 'left',
      smooth: true,
      fill: false,
      xField: 'yymm',
      yField: 'PM預測',
      markerConfig: {
        type: 'circle',
        size: 4,
        radius: 4,
        'stroke-width': 0
      }
    }, {
      type: 'line',
      highlight: {
        size: 7,
        radius: 7
      },
      axis: 'left',
      smooth: true,
      fill: false,
      xField: 'yymm',
      yField: 'Sales預測',
      markerConfig: {
        type: 'circle',
        size: 4,
        radius: 4,
        'stroke-width': 0
      }
    }]
  });

  var panel = Ext.create( 'widget.panel', {
    width: 367,
    height: 155,
    title: '',
    renderTo: 'grid-linechart',
    layout: 'fit',
    /*tbar: [{
      text: 'Save Chart',
      handler: function () { downloadChart(chart3); }
    }],*/
    items: chart
  });
最後,將 Chart 透過 Panel render 到頁面指定的位置,即大功告成。(圖2)
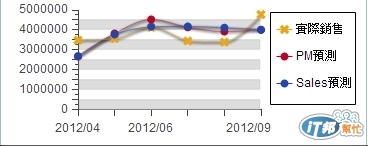
圖2:Ext js Chart Demo


 iThome鐵人賽