這篇教學會延續上一篇,但在開始之前我們先將上一次的資料保存起來,我們可以使用write.csv() 來儲存資料結構,存放在output資料夾。
write.table(result, file="output/category_income_by_month.csv", sep = ",", row.names=FALSE, col.names = TRUE)

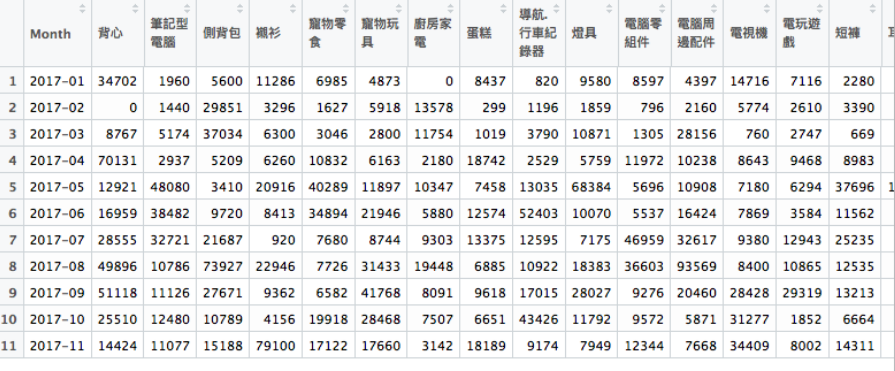
然後在重新讀取該csv 來模擬如果我們今天拿到的報表或資料庫形式就是昨天的格式時,該如何來進行分析,也就是下面這張欄位長長的table。
category_income <- read.csv("output/category_income_by_month.csv", stringsAsFactors=FALSE)
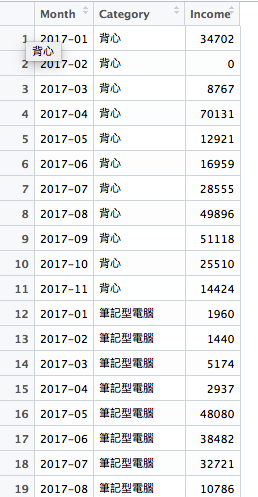
前一天的教學講了如何使用spread 將資料的某欄位切格成多個欄位,今天要講的是如何逆向將多個欄位合併成單一個欄位,我們可以使用gather() 來解決,第一個參數放的是組合之後的欄位名稱,第二個參數放”組合值”的欄位名稱,第三個參數是哪些欄位要被組,na.rm可以決定要不要去除空欄位。
result <- category_income %>%
    gather(Category, Income, 2:73, na.rm=FALSE)
執行完成後,可以看到資料表變回先前的格式啦。
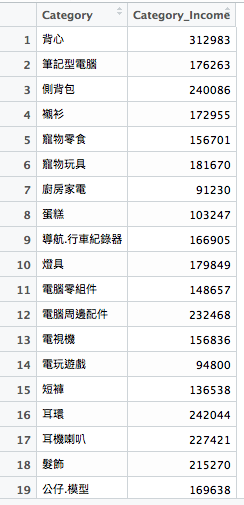
剩下的步驟很簡單,我們group_by 不同的Category,然後計算各個Category 的總Income 就可以獲取結果了。
result <- category_income %>%
    gather(Category, Income, 2:73, na.rm=FALSE) %>%
    group_by(Category) %>%
    summarise(Category_Income = sum(Income))
畫出圓餅圖表
ggplot(result, aes(x="", y=Category_Income, fill=Category)) +
    geom_bar(width = 1, stat = "identity") +
    coord_polar("y", start=0) +
    theme(text=element_text(family="黑體-繁 中黑", size=12))
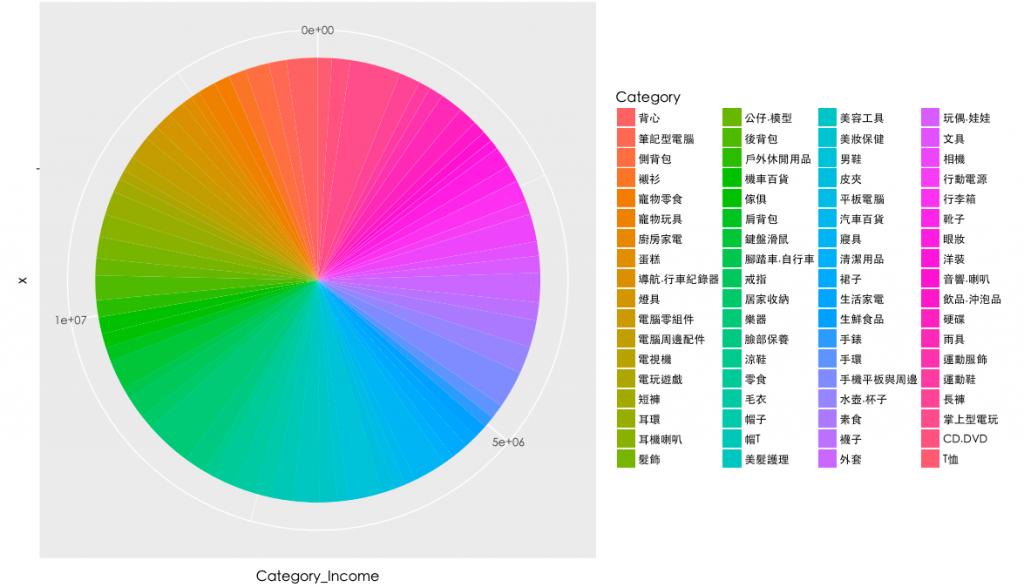
痾...看來我的亂數分布的有些平均...每個項目都差不多啊...囧,沒關係,我們用文字來表達,使用arrange() 來排列報表。
result <- category_income %>%
    gather(Category, Income, 2:73, na.rm=FALSE) %>%
    group_by(Category) %>%
    summarise(Category_Income = sum(Income)) %>%
    arrange(desc(Category_Income))
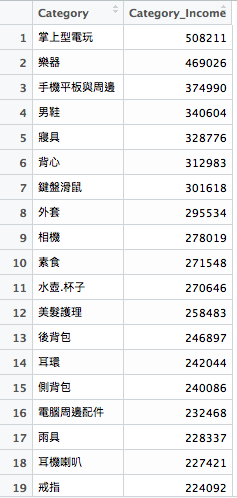
有此便可得知,前幾名的營收類別是什麼囉!
ref:
day6原始碼


 iThome鐵人賽