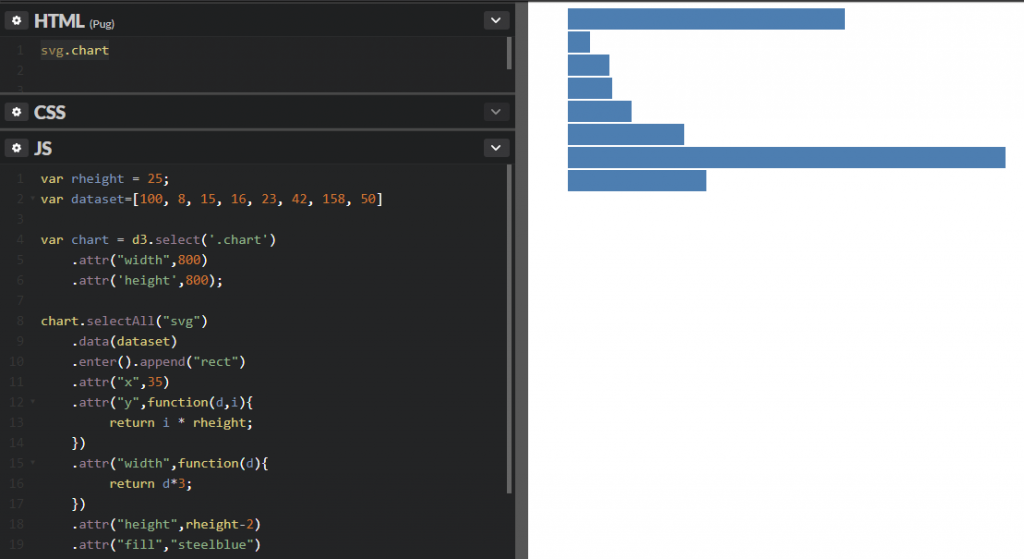
首先一樣先在網頁上放點東西
svg.chart
再用d3來把圖表畫上去
var rheight = 25;
var dataset=[100, 8, 15, 16, 23, 42, 158, 50]

var chart = d3.select('.chart')
	.attr("width",800)
	.attr('height',800);
因為使用svg,所以先定義畫布的大小
chart.selectAll("svg")
	.data(dataset)
  	.enter().append("rect")
    .attr("x",35)
    .attr("y",function(d,i){
         return i * rheight;
    })
    .attr("width",function(d){
         return d*3;
    })
    .attr("height",rheight-2)
    .attr("fill","steelblue")
再把資料一個一個畫進去,可以善用function處理這些事
結果
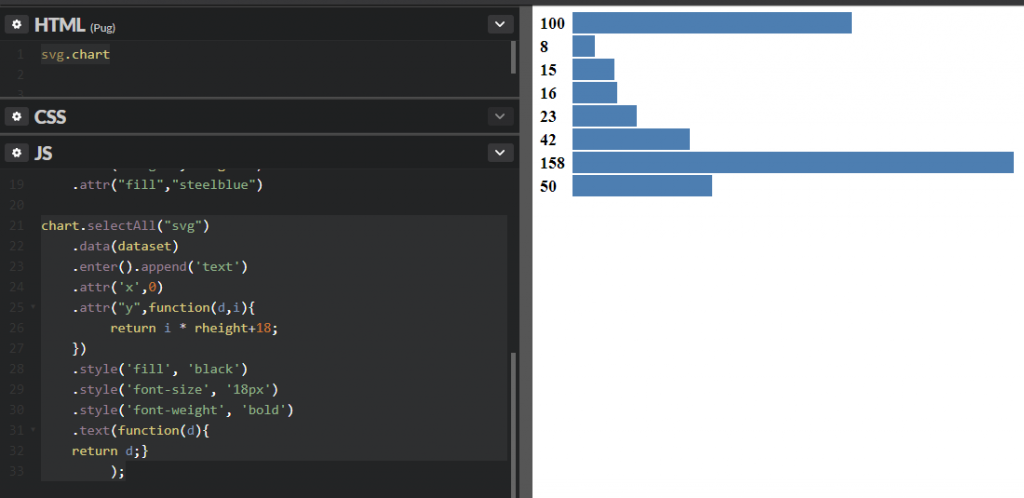
想在圖表的前面,寫上每條的大小
chart.selectAll("svg")
	.data(dataset)
	.enter().append('text')
	.attr('x',0)
	.attr("y",function(d,i){
         return i * rheight+18;
    })
	.style('fill', 'black')
	.style('font-size', '18px')
	.style('font-weight', 'bold')
	.text(function(d){
	return d;}
		 );
因為前面是用SVG,所以這邊也使用SVG方便對位
結果
本次程式碼 https://codepen.io/FanWay/pen/jYLboM
