昨天我們建立了一個初步的地圖,webGIS中,除了基本工具的建立,加入主題性POI資料是主要功能,除了把POI加入地圖以外,也必須有瀏覽POI列表及瀏覽詳細資料的操作。
今天就繼續昨天的成果,使用Leaflet實作POI資料瀏覽及其事件綁定的工作,資料部分,就以我們團隊成員建立的網球場資料(僅放部分)作為webGIS POI瀏覽範例吧。
首先new 一個pois圖層,在geojson讀進來之後,把資料放進去,並透過pointToLayer把marker放上地圖,其中,icon部分根據場地性質(硬地、草地、紅土)給予不同的圖片。
app.js
//pois圖層
var pois = L.geoJson(null, {
  pointToLayer: function (feature, latlng) {
  //根據場地性質給不同marker icon
    var icon;
    if (feature.properties.surface == "紅土[clay]")
      icon = "./dist/assets/img/tennis-red.png";
    else if (feature.properties.surface == "硬地[hard]")
      icon = "./dist/assets/img/tennis-blue.png";
    else if (feature.properties.surface == "草地[grass]")
      icon = "./dist/assets/img/tennis-green.png";
    else
      icon = "./dist/assets/img/globe.png";

    return L.marker(latlng, {
      icon: L.icon({
        iconUrl: icon,
        iconSize: [24, 24],
        iconAnchor: [12, 12],
        popupAnchor: [0, -25]
      }),
      title: feature.properties.name,
      riseOnHover: true
    });
  },

..略

讀入
$.getJSON("./dist/assets/data/map.geojson", function (data) {
  pois.addData(data);
  map.addLayer(pois);
});
我們先把list的div設置好,其中poi-list是主要的table。
index.cshtml
 <div id="sidebar">
    ...略

        <div class="sidebar-table">
          <table class="table table-hover" id="poi-list">
            <thead class="hidden">

            </thead>
            <tbody class="list"></tbody>
          </table>
        </div>

     ...略

  </div>
然後,在pois之中加入onEachFeature,遍歷每一筆資料並把每一條record組好放入list table中
  onEachFeature: function (feature, layer) {
    if (feature.properties) {
      $("#poi-list tbody").append('<tr class="feature-row" id="' + L.stamp(layer) + '" lat="' + layer.getLatLng().lat + '" lng="' + layer.getLatLng().lng + '"><td style="vertical-align: middle;"><img width="16" height="18" src="' + layer.options.icon.options.iconUrl + '"></td><td class="feature-name">' + layer.feature.properties.name + '</td><td style="vertical-align: middle;"><i class="fa fa-chevron-right pull-right"></i></td></tr>');

}
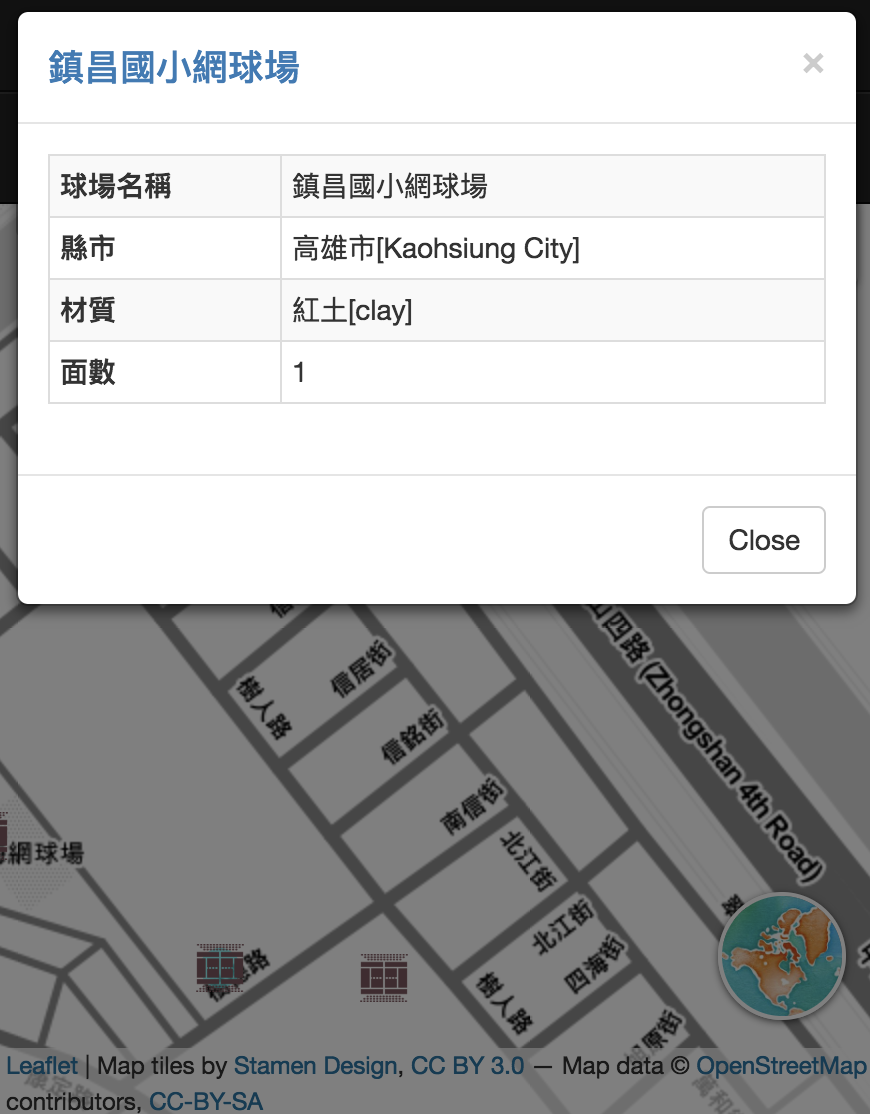
詳細資料我們這邊採用boostrap的modal,先在html加入div。
index.cshtml
   <div class="modal fade" id="featureModal" tabindex="-1" role="dialog">
      <div class="modal-dialog">
        <div class="modal-content">
          <div class="modal-header">
            <button class="close" type="button" data-dismiss="modal" aria-hidden="true">×</button>
            <h4 class="modal-title text-primary" id="feature-title"></h4>
          </div>
          <div class="modal-body" id="feature-info"></div>
          <div class="modal-footer">
            <button type="button" class="btn btn-default"  data-dismiss="modal">Close</button>
          </div>
        </div>
      </div>
    </div>
接下來,在pois的onEachFeatured中把modal之中的內容組好,
接著綁定click事件。
app.js
 var content = "<table class='table table-striped table-bordered table-condensed'>" + "<tr><th>球場名稱</th><td>" + feature.properties.name + "</td></tr>" + "<tr><th>縣市</th><td>" + feature.properties.city + "</td></tr>" + "<tr><th>材質</th><td>" + feature.properties.surface + "</td></tr>" + "<tr><th>面數</th><td>" + layer.feature.properties.number_of_courts + "</td></tr></table> ";

    click: function (e) {
          $("#feature-title").html(feature.properties.name);
          $("#feature-info").html(content);
          $("#featureModal").modal("show");
在list中也要綁定click,讓使用者點擊地圖marker或list的item都可以開啟詳細資料modal,此外,在list之中開啟modal還要順便移動中心點喔。
$(document).on("click", ".feature-row", function (e) {
  sidebarClick(parseInt($(this).attr("id"), 10));
});

function sidebarClick(id) {
  var layer = pois.getLayer(id);
  map.setView([layer.getLatLng().lat, layer.getLatLng().lng], 17);
  layer.fire("click");
}
版面調整的工事比較瑣碎,主要包含slidebar的開關,nav-bar的微調(藉由boosrap的RWD特性),直接看成果,相關內容可以參考程式碼。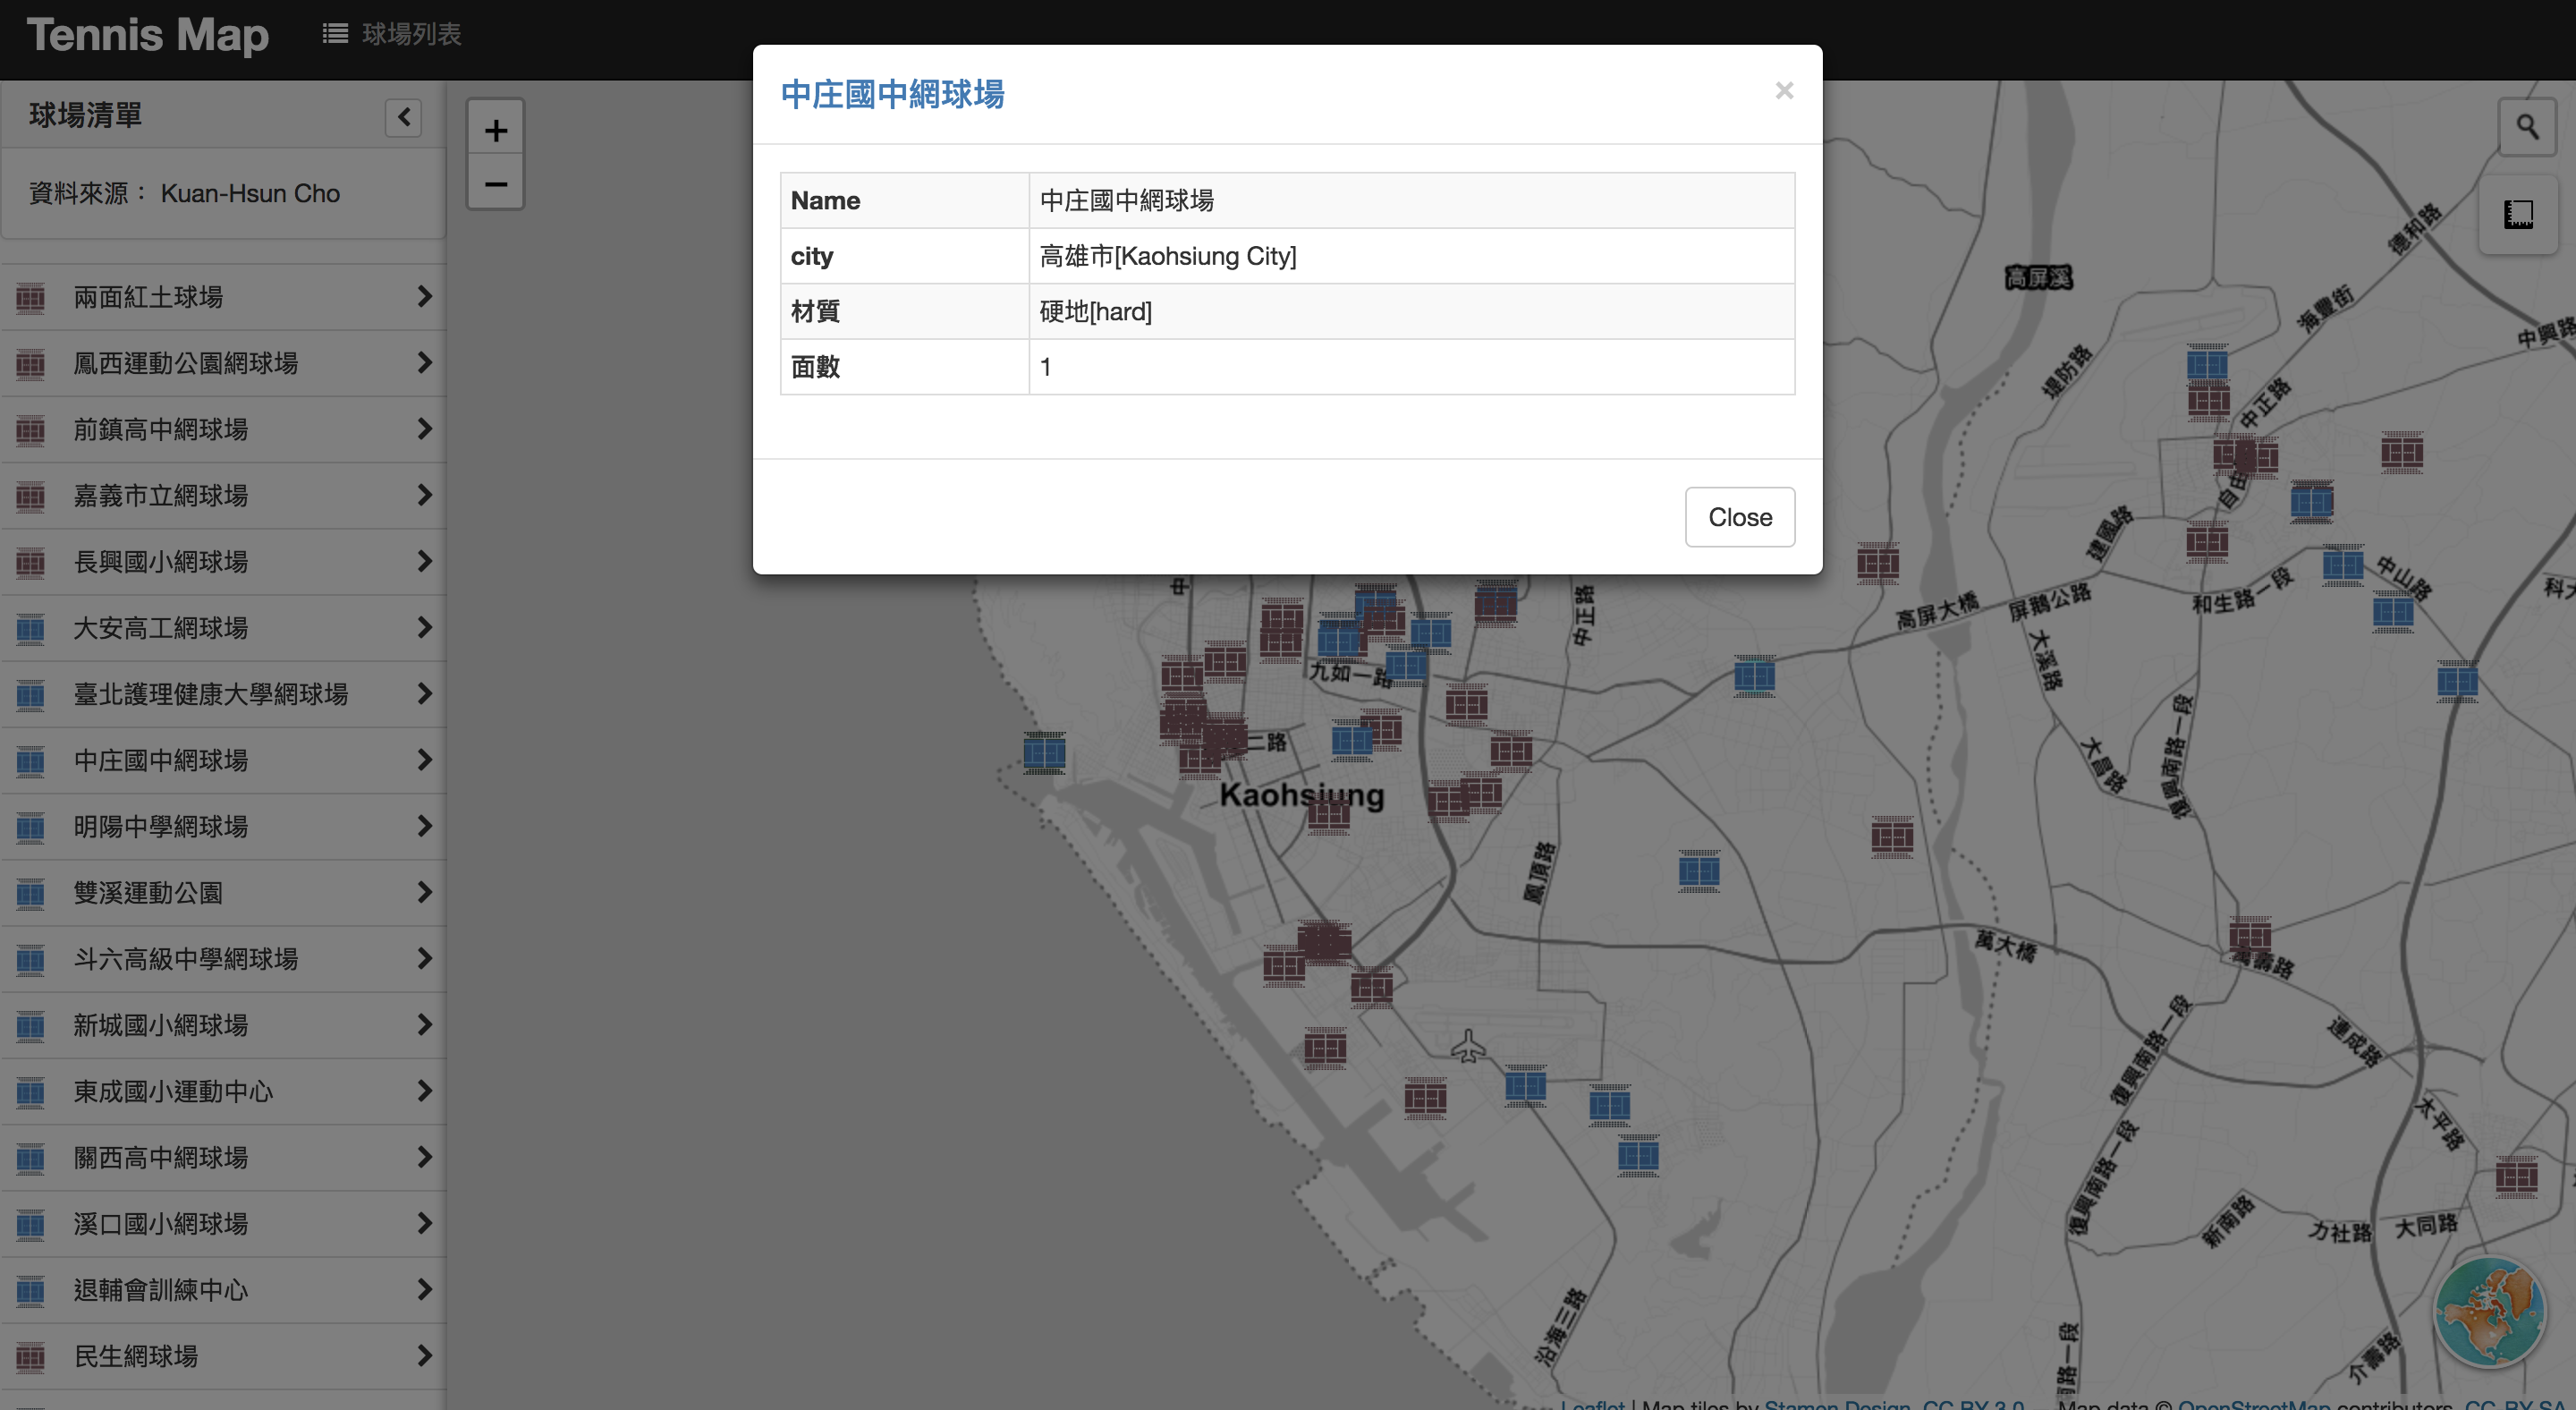
手機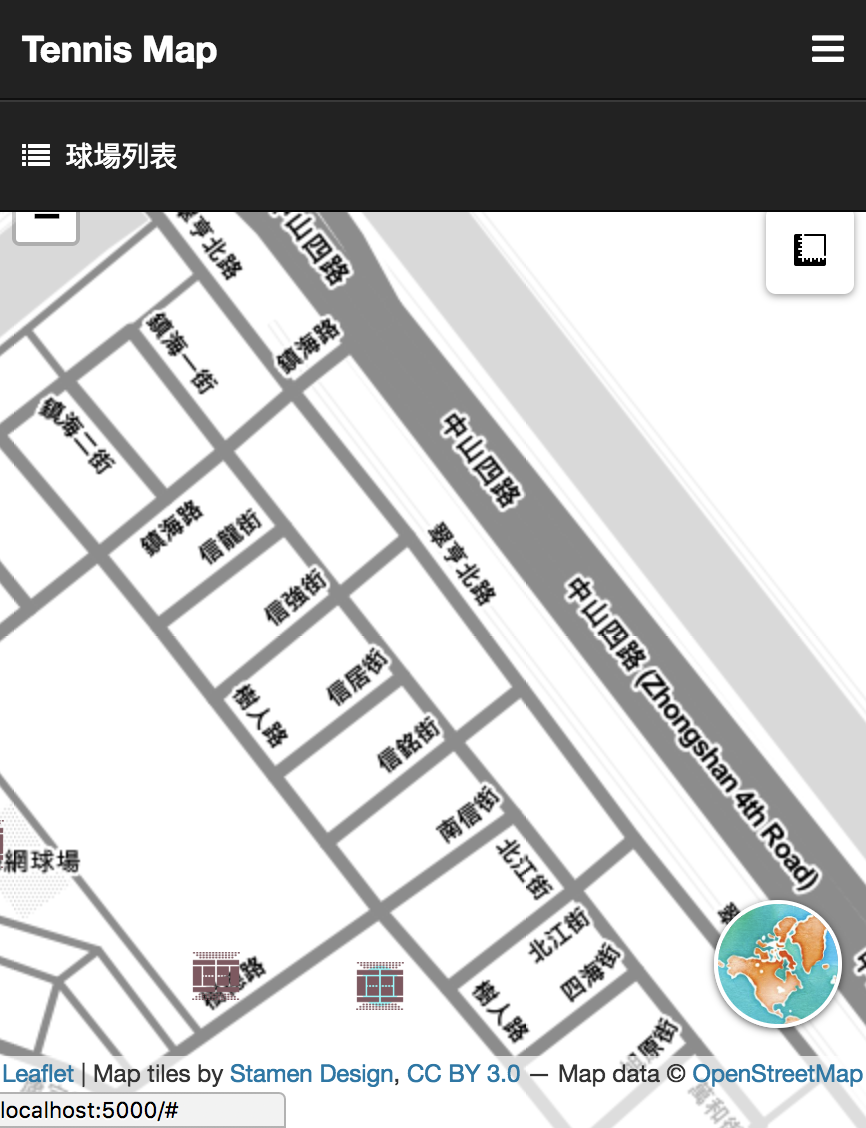
今天完成基本的資料及事件綁定,其中有一些今天沒做到但常見的部分,例如在table list部分可以增加一些filter功能,可以參考list.js等等,而今天的程式碼都會放在github(day17有一個commit)供參考喔。


 iThome鐵人賽