最近的台鐵意外事件,看到有媒體及網友製作前端的網頁地圖呈現通話紀錄,剛好昨天使用了folium,一時興起今天也來用folium做看看,今天先來做一些前處理
ps. 另外,也祝傷者平安及亡者安息
要呈現這樣的圖,包括了以下幾種資料:
網站上的逐字稿在上面的新聞網站可以看到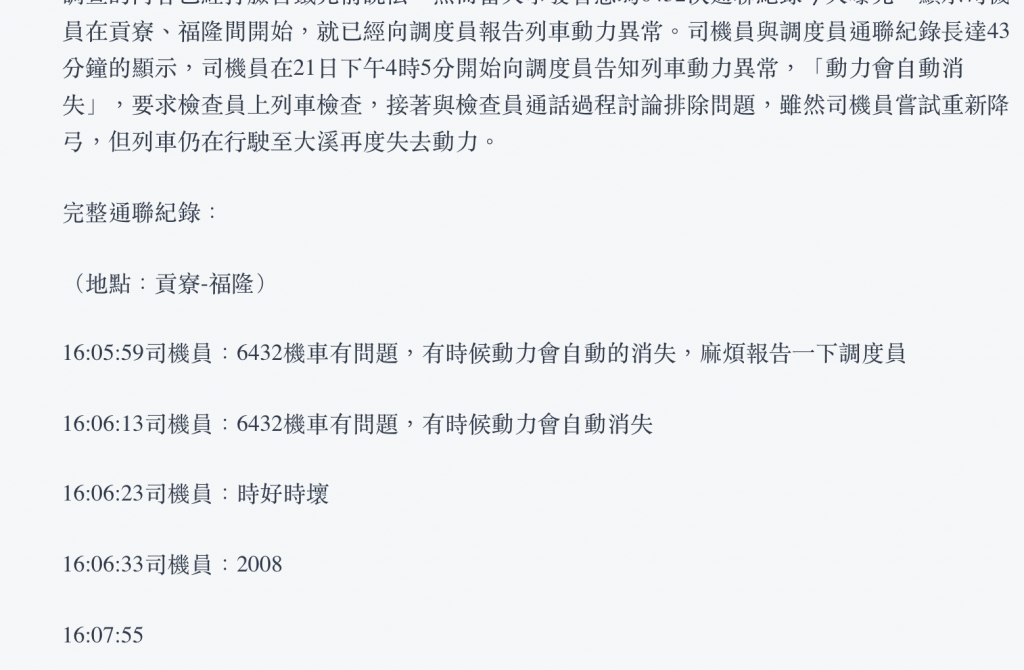
我們試著把它結構化,我們使用requests去get網頁文檔,並用BeautifulSoup結構化資料
import requests
import pandas as pd
import geopandas as gpd
import re
from bs4 import BeautifulSoup

result=requests.get('https://news.ftv.com.tw/AMP/News_Amp.aspx?id=2018A25W0003')
from bs4 import BeautifulSoup
soup = BeautifulSoup(result.text, 'html.parser')
有關這些技術細節,請參考以下程式碼
p_count=0
start_flag=False
p_contents=soup.find_all('p')
all_data=[]
location=""
time=""
for p_item in p_contents:

    text=str(p_item.text)
    if text =='完整通聯紀錄:':
        start_flag=True
        p_count+=1
        continue

    if len(re.findall('地點',text))>0:
        location=text
        continue

    if len(text.split(':'))==3 and len(text)==8:
        time=text
        continue

    # 處理前幾行
    if start_flag==True:
        if  p_count<4:
            p_count+=1
            time=text[0:8]
            all_data.append([location,time,text[8:]])
        else:
            all_data.append([location,time,text])

all_data
整理好會變這樣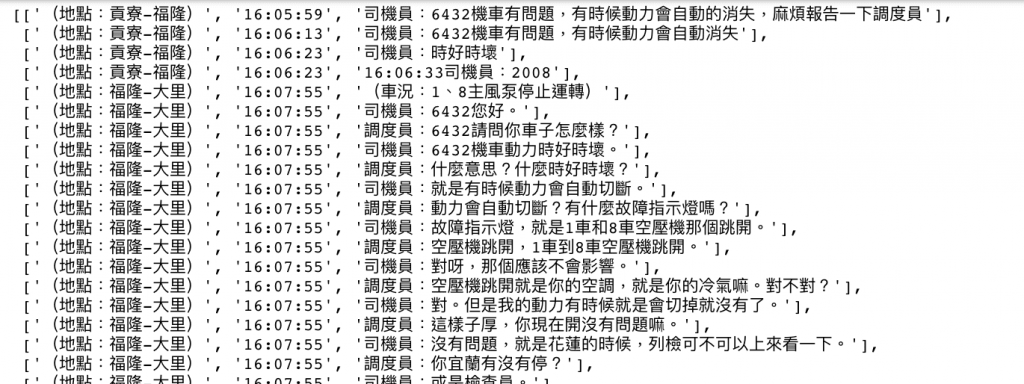
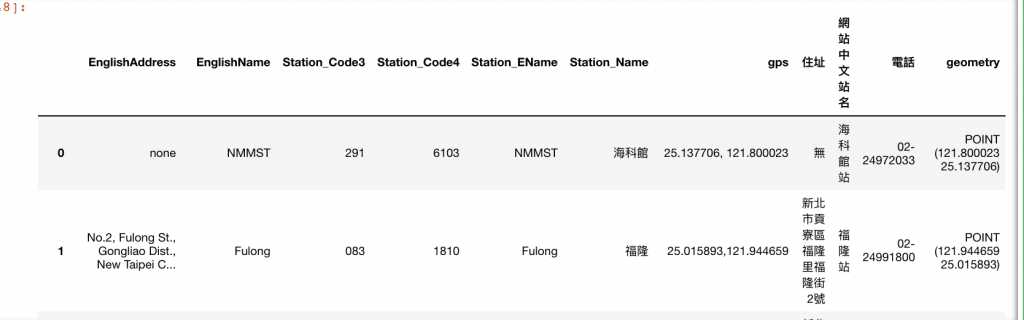
首先,我們把車站資料處理成GIS資料,利用pandas2geopandas的技巧:
from shapely.geometry import Point
station_pd=pd.read_json('data/Station/Station.json', 'r', encoding='utf-8-sig')
station_pd=station_pd[station_pd['gps']!='']
y = [float(row['gps'].split(',')[0].replace(' ','')) for idx,row in station_pd.iterrows()]
x = [float(row['gps'].split(',')[1].replace(' ','')) for idx,row in station_pd.iterrows()]
geom = [Point(xy) for xy in zip(x, y)]
crs = {'init': 'epsg:4326'}
station = gpd.GeoDataFrame(station_pd, crs=crs, geometry=geom)
station[['Station_Name','geometry']].to_file('output/station.shp')
station
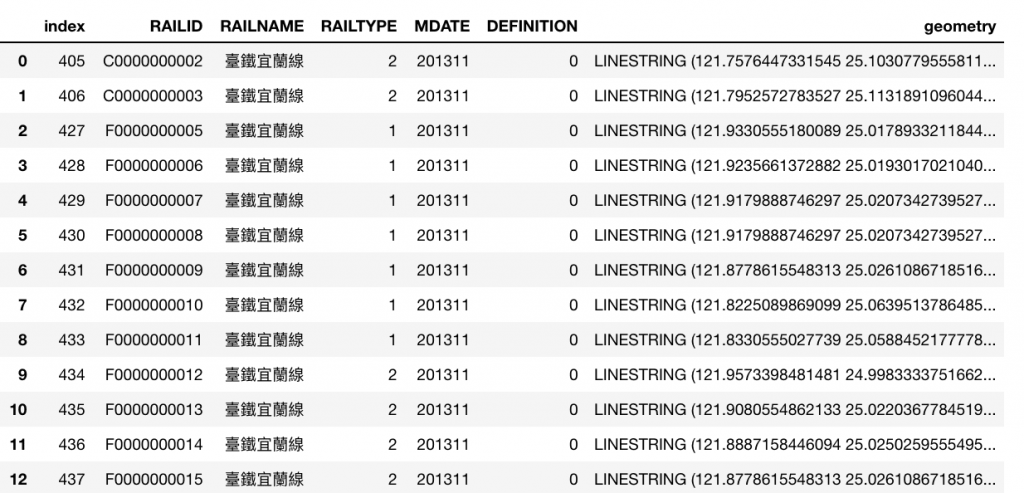
然後把第一天出現過的鐵路資料再拿來,並且選擇臺鐵宜蘭線
rail=gpd.read_file('data/Rail/Rail.shp',encoding='utf-8')
rail.crs = {'init' :'epsg:3826'} # 避免資料沒設,這邊再重新給一次
rail=rail.to_crs(epsg=4326)
# rail.groupby('RAILNAME').size()
rail=rail[rail['RAILNAME']=='臺鐵宜蘭線']
rail.reset_index(inplace=True)
rail
先觀察一下資料,我們把他們一起畫在地圖上瀏覽:
import folium
m = folium.Map((24.694192,121.775163),zoom_start=18)

folium.GeoJson(
    station.to_json(),
    name='geojson'
).add_to(m)

rail_geojson  = folium.GeoJson(
    rail.to_json(),
    name='geojson',

)
popup = folium.Popup('Hi')
popup.add_to(rail_geojson)
rail_geojson.add_to(m)

m
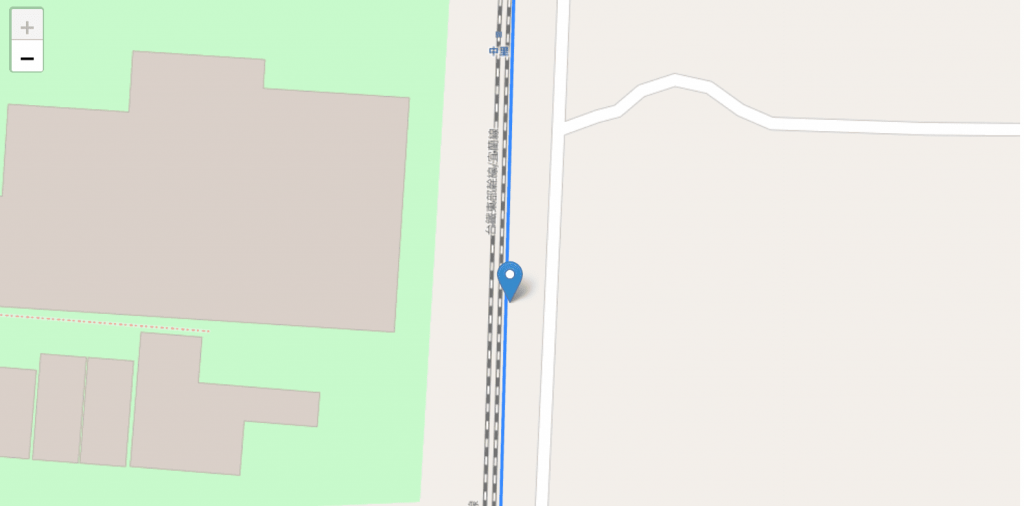
由於車站的資料與鐵路資料有一點gap,也就是說車站的點不會在鐵路線上,這會影響到展示,
因此,我們試著把他投影到線上,這邊的投影我們直接使用向量內外積來處理: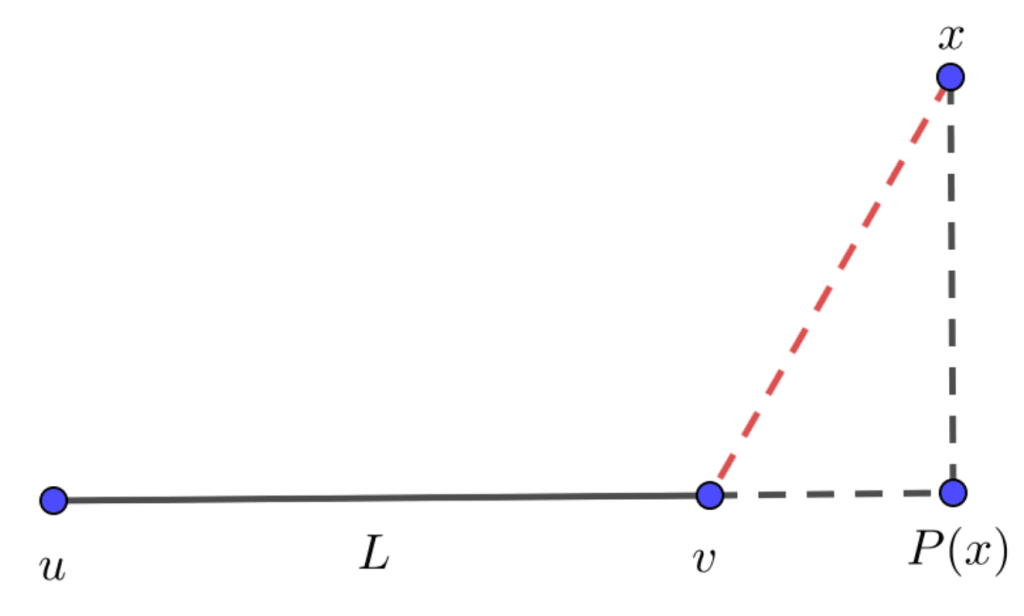
計算過程中,我們把每個元素的投影都算一遍,並取距離最短的點,作為車站修正後的值
import numpy as np
from shapely.geometry import Point


for i1,r1 in station.iterrows():
    point=r1['geometry']
    min_distance=999
    new_point=point
    for i2,r2 in rail.iterrows():

        line = r2['geometry']

        x = np.array(point.coords[0])

        u = np.array(line.coords[0])
        v = np.array(line.coords[len(line.coords)-1])

        n = v - u
        n /= np.linalg.norm(n, 2)

        P = u + n*np.dot(x - u, n)
        distance=Point(P).distance(point)
        if distance<min_distance:
            min_distance=distance
            new_point=Point(P)
    station.at[i1,'geometry']=new_point
還有另外一種解法,在第七天的時候我們提到shapely的project與interpolate
這兩個連續技,結果跟上面是一樣的new_point = line.interpolate(line.project(point))
for i1,r1 in station.iterrows():
    point=r1['geometry']
    min_distance=999
    new_point=point
    for i2,r2 in rail.iterrows():

        line = r2['geometry']
        temp_point = line.interpolate(line.project(point))
        distance=temp_point.distance(point)
        if distance<min_distance:
            min_distance=distance
            new_point=temp_point
    station.at[i1,'geometry']=new_point
上面的方法二選一,再用前面的code繪製一次成果,可以看到車站已經被修正在鐵路網上!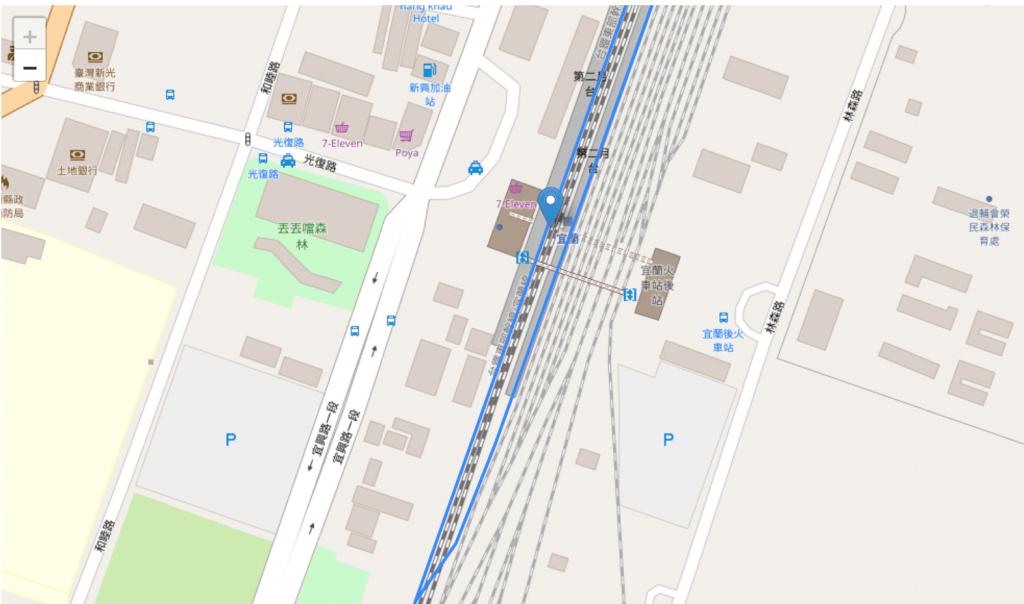
今天我們完成了一些前處理
雖然這些前處理其實有些也沒這麼必要,甚至手動畫一畫就好了,不過基於練習的精神還是明天繼續把它完成吧
下班時間有點晚,明天再加油!
對今天的測試有興趣請參考github程式碼


 iThome鐵人賽