iT邦幫忙

2019 iT 邦幫忙鐵人賽

DAY 22
0
Everything on Azure

Azure Machine Learning Studio系列 第 22

Azure Machine Learning Studio 使用 R - Execute R Script

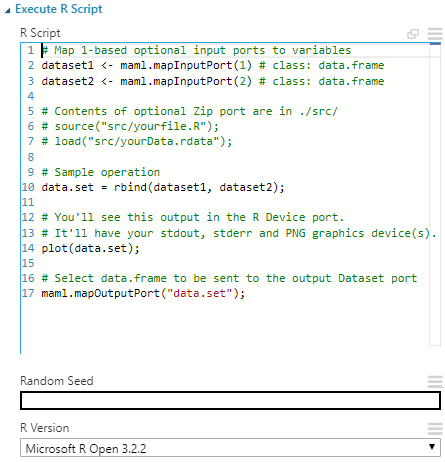
在 Azure Machine Learning Studio 中,若想要透過 R 語言擴充其功能,可以使用 Execute R Script,直接將程式碼貼至 R Script 區域就可以執行,下圖為預設的 R 程式碼內容,若執行成功會看到 Execute R Script 出現綠勾勾,若失敗則會顯示紅驚嘆號,失敗原因可以從屬性下方的 View output log 查看

https://ithelp.ithome.com.tw/upload/images/20181104/20111935I82GDFO676.png

https://ithelp.ithome.com.tw/upload/images/20181104/20111935PnDWYPlNww.png

Azure Machine Learning Studio 支援許多 R 套件,可以參考官網提供的 R 套件支援清單:R Packages supported by Azure Machine Learning Studio

使用 Execute R Script 列出所有目前安裝的封裝

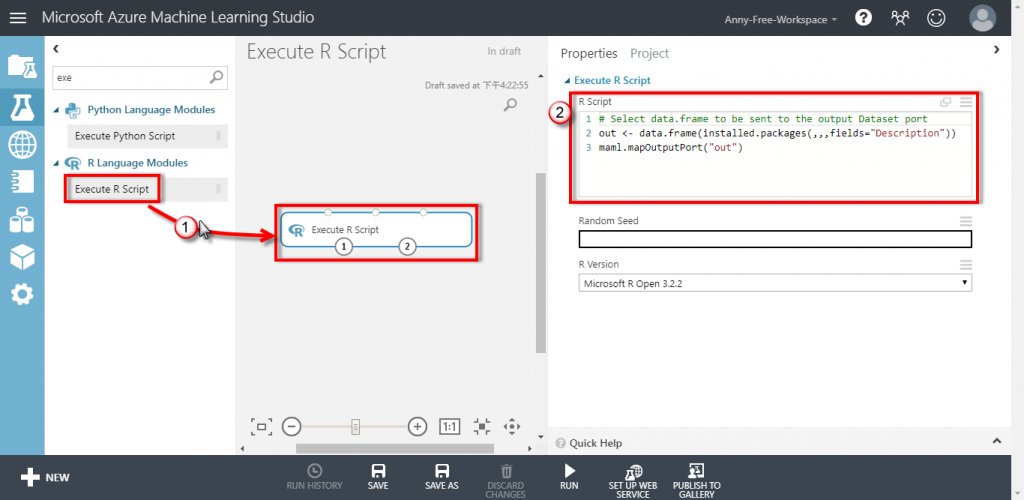
  1. 新增 Execute R Script,將以下 R 指令輸入至 R Script

    # Select data.frame to be sent to the output Dataset port
    out <- data.frame(installed.packages(,,,fields="Description"))
    maml.mapOutputPort("out")
    

    https://ithelp.ithome.com.tw/upload/images/20181104/20111935aaPuBFGbE7.png

  2. 新增 Convert to CSV 將執行後結果轉換成 CSV 檔案格式,執行完成後,滑鼠右鍵點選 Download 下載 CSV 檔案
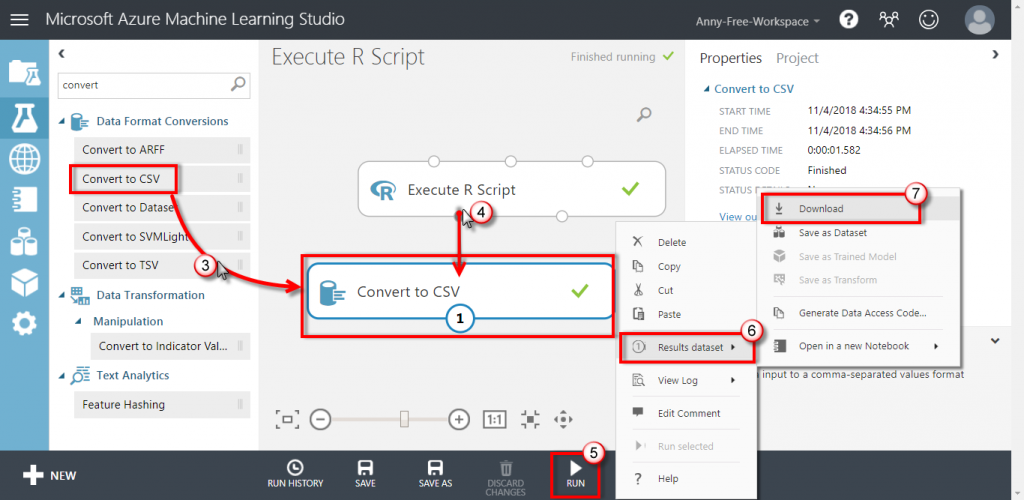
    https://ithelp.ithome.com.tw/upload/images/20181104/20111935RPySPqKnsD.png

  3. 開啟 CSV 檔可以看到目前的安裝清單
    https://ithelp.ithome.com.tw/upload/images/20181104/201119359f3w9xxSrC.png

使用 R pairs( ) 檢視鳶尾花花萼長寬與花瓣長寬資料的散佈圖矩陣

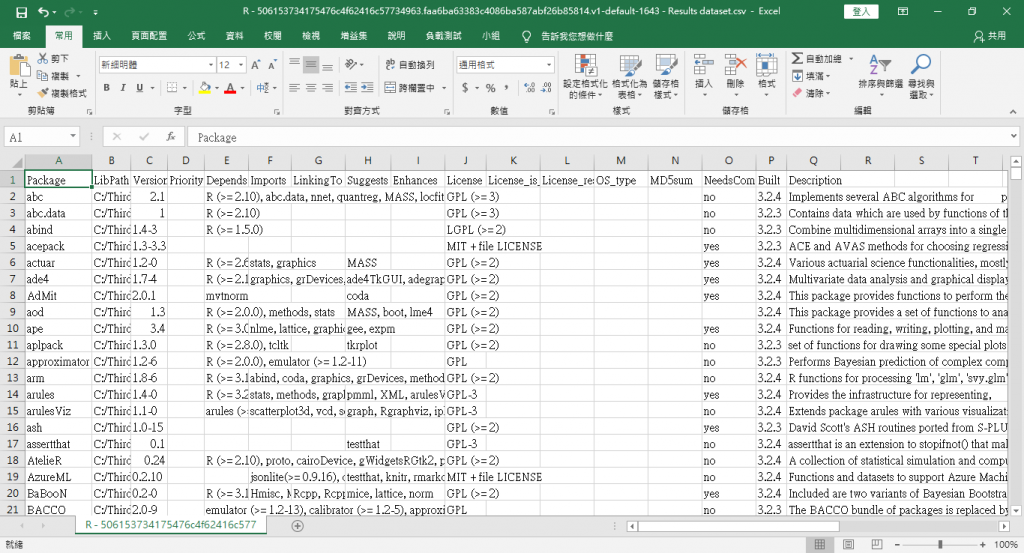
  1. 新增 Iris Two Class Data 鳶尾花二元分類資料集
    https://ithelp.ithome.com.tw/upload/images/20181104/20111935NIzvT05i9I.png

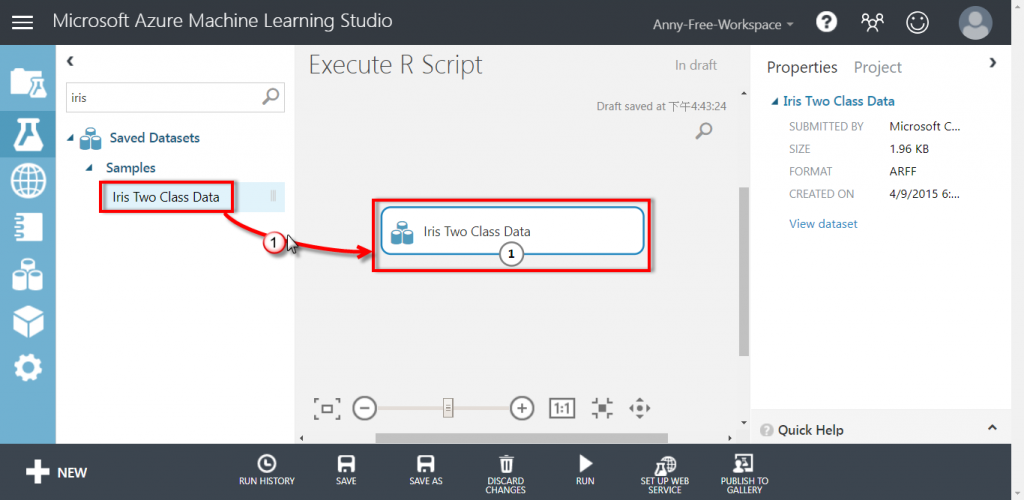
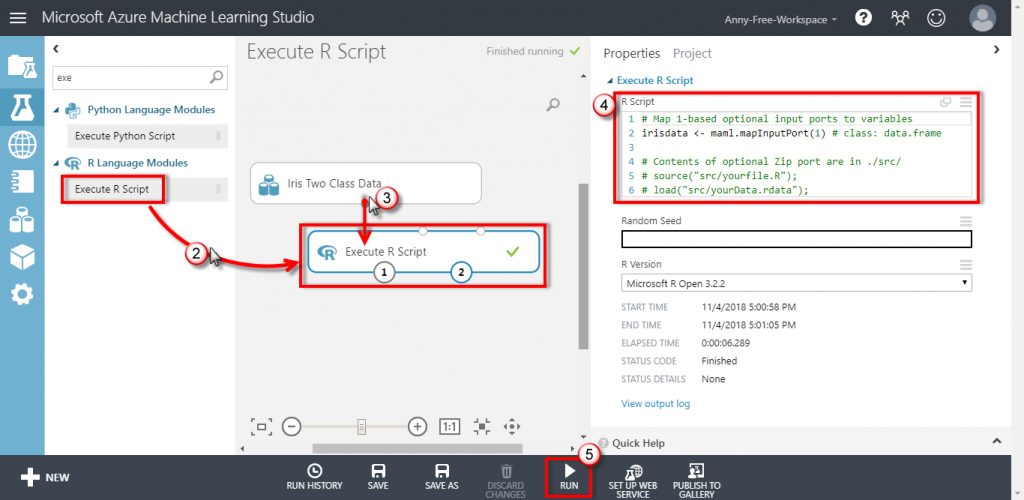
  2. 新增 Execute R Script,將資料集輸出接至 Execute R Script 的第一個輸入,R Script 區域輸入以下 R 語言:

    # Map 1-based optional input ports to variables
    irisdata <- maml.mapInputPort(1) # class: data.frame
    
    # Contents of optional Zip port are in ./src/
    # source("src/yourfile.R");
    # load("src/yourData.rdata");
    
    # Sample operation
    str(irisdata)
    pairs(irisdata[2:5], data = irisdata)
    
    # You'll see this output in the R Device port.
    # It'll have your stdout, stderr and PNG graphics device(s).
    
    # Select data.frame to be sent to the output Dataset port
    maml.mapOutputPort("irisdata");
    

    https://ithelp.ithome.com.tw/upload/images/20181104/2011193552G1nRVuFd.png

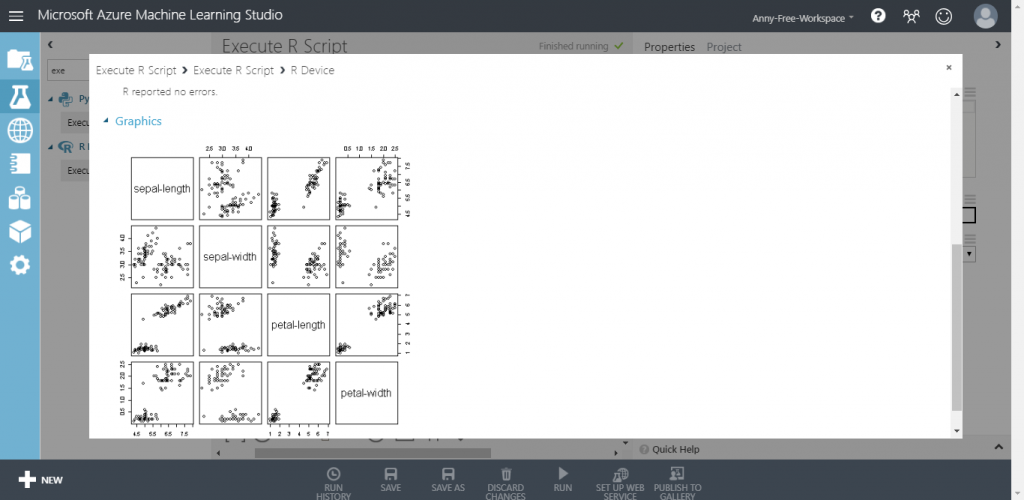
  3. 執行完成後,滑鼠右鍵點選 R Device 的 Visualize 檢視結果
    https://ithelp.ithome.com.tw/upload/images/20181104/20111935n0RjEMjzWd.png

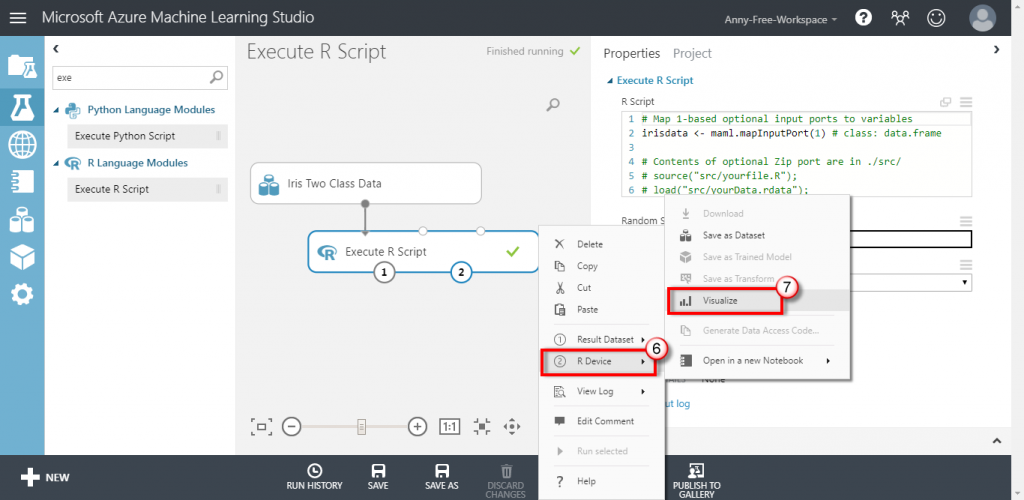
  4. 可以看到以下 4 個欄位分別與其他欄位的分佈關係:

    • 花萼長度(sepal-length)
    • 花萼寬度(sepal-width)
    • 花瓣長度(petal-length)
    • 花瓣寬度(petal-width)
      https://ithelp.ithome.com.tw/upload/images/20181104/20111935ZgJPBcqbjm.png

上一篇
Azure Machine Learning Studio 分群 - K-Means Clustering
下一篇
Azure Machine Learning Studio 迴歸 Regression
系列文
Azure Machine Learning Studio30
圖片
  直播研討會
圖片
{{ item.channelVendor }} {{ item.webinarstarted }} |
{{ formatDate(item.duration) }}
直播中

尚未有邦友留言

立即登入留言