OSMnx除了介接了Overpass API,可以透過python方便的取得OpenStreetMap的圖資以外,它還提供了一些路網相關的分析方法,這些方法主要是來自networkX。
大綱:
計算最短路徑跟前兩天測試的是networkX差不多的:
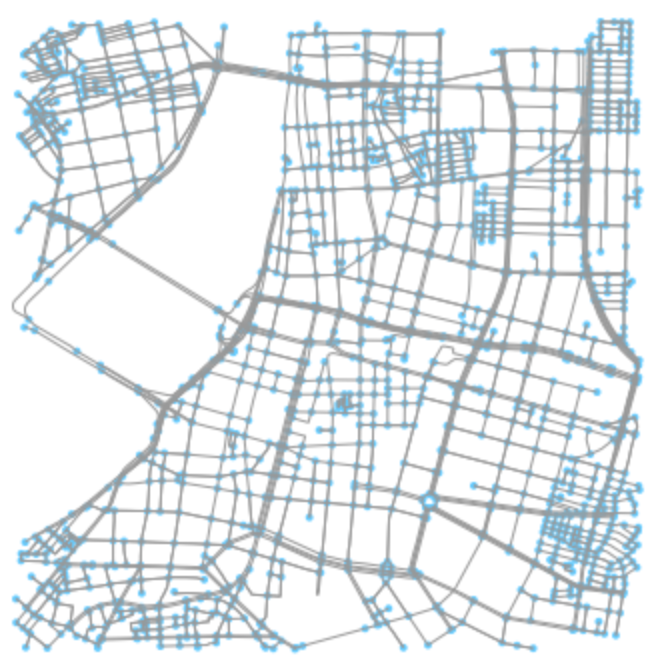
首先,先取得資料
import osmnx as ox
G = ox.graph_from_point((25.048545,121.51123), distance=3000, network_type='drive')
ox.plot_graph(G)

接著我們給定原點跟目的地的坐標,然後計算其node的編號,使用的是ox.get_nearest_node
origin = ox.get_nearest_node(G, (25.049545,121.5599))
destination = ox.get_nearest_node(G, (25.048545,121.51123))
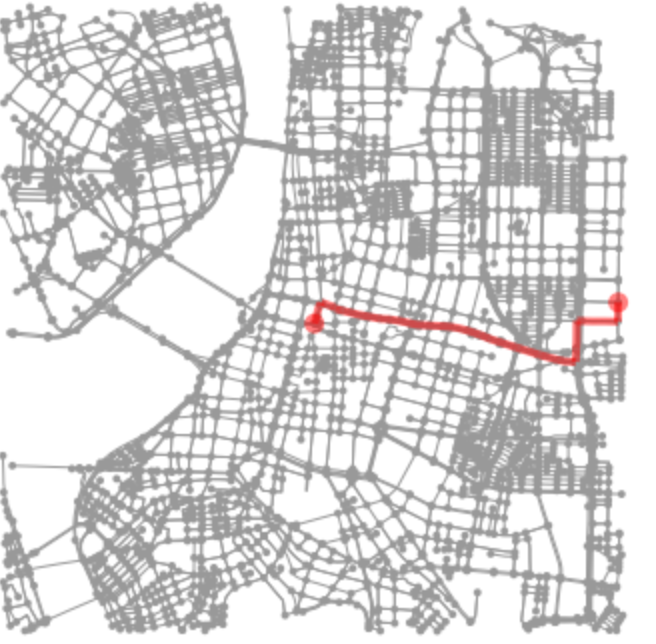
要計算最短路徑,用的是networkx的shortest_path()方法,把剛剛的origin與destination輸入並繪圖
import networkx as nx
route = nx.shortest_path(G, origin, destination)
ox.plot_graph_route(G, route)

除了最短路徑分析以外,
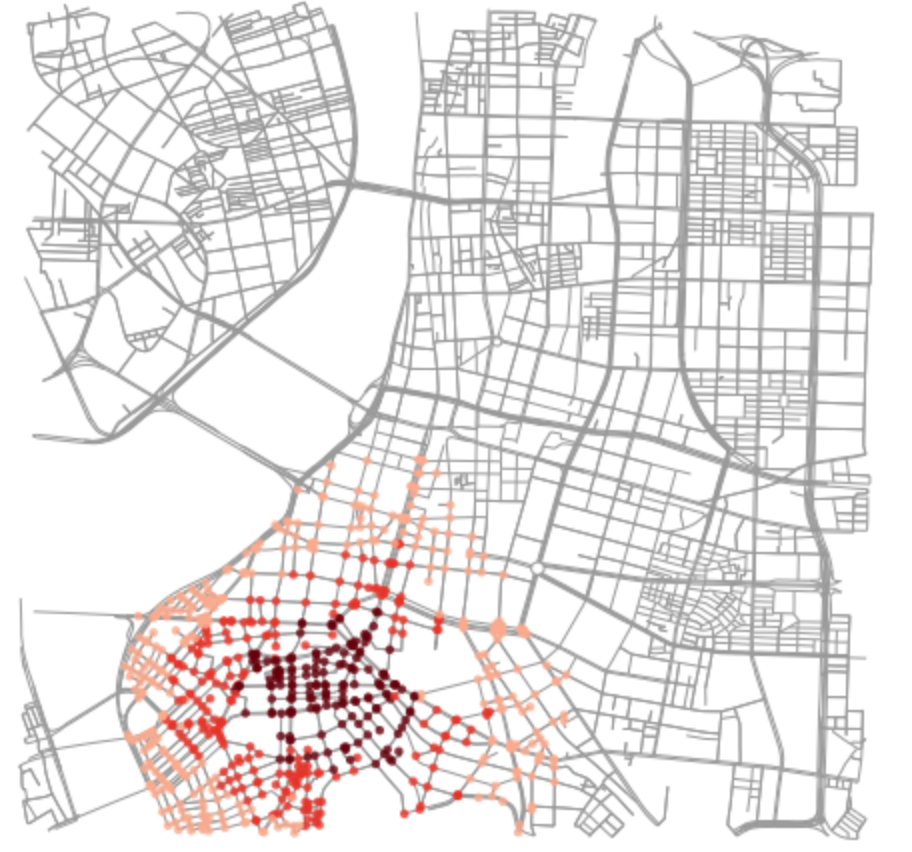
等時圈也是路網分析的經典演算法,透過路網可以算出以某點為中心點,特定時間內可以抵達的範圍:
首先,我們先取得資料(跟上面一樣)
import osmnx as ox
G = ox.graph_from_point((25.048545,121.51123), distance=2000, network_type='drive')
ox.plot_graph(G)
G = ox.project_graph(G) # 投影
接著,以下方法取得中心點node
center_node = ox.get_nearest_node(G, (25.048545,121.51123))
給予每個edge速度,單位是每分鐘的公尺數
meters_per_minute = 10 * 1000 / 60 # 每小時10公里
for u, v, k, data in G.edges(data=True, keys=True):
    data['time'] = data['length'] / meters_per_minute
官網提供的範例是利用networkx的ego_graph,ego_graph會回傳一個graph中心點一定範圍的節點子graph,運算的單位可以是edge的weight等等,這邊範例是使用time(所以要配合上面先提供每個edge'time'),詳請請看networkx官方文件。
import networkx as nx
trip_times = [5, 8, 12] #分鐘
# 給定顏色
iso_colors = ox.get_colors(n=len(trip_times), cmap='Reds', start=0.3, return_hex=True)
node_colors = {}
for trip_time, color in zip(sorted(trip_times, reverse=True), iso_colors):
    subgraph = nx.ego_graph(G, center_node, radius=trip_time, distance='time')
    for node in subgraph.nodes():
        node_colors[node] = color # 抵達的node給顏色
根據上面抵達的node邊界,再給一次範圍內的顏色,並畫圖
nc = [node_colors[node] if node in node_colors else 'none' for node in G.nodes()]
ns = [20 if node in node_colors else 0 for node in G.nodes()]
fig, ax = ox.plot_graph(G, fig_height=8, node_color=nc, node_size=ns, node_alpha=0.8, node_zorder=2)
成果:
