昨天我們主要應用OSM的路網資料,除了路網,OSMnx還有其他的資料可以使用,今天就繼續OSMnx吧!
大綱:
OSMnx有一個buidling模組,跟路網一樣,他可以把OSM上的建物輪廓資料取下,取下來的資料是GeoDataFrame
b=ox.buildings.buildings_from_point((25.048545,121.51123), 300, retain_invalid=False)
b

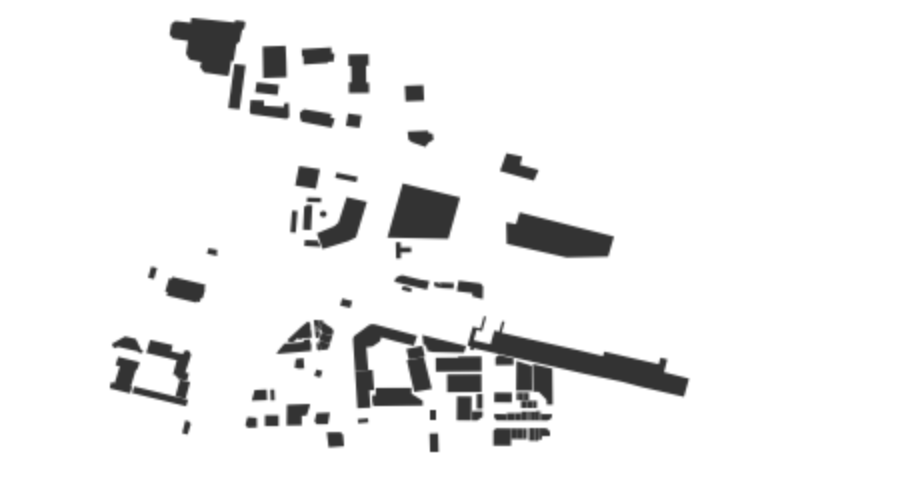
building可以直接繪圖
ox.buildings.plot_buildings(b)
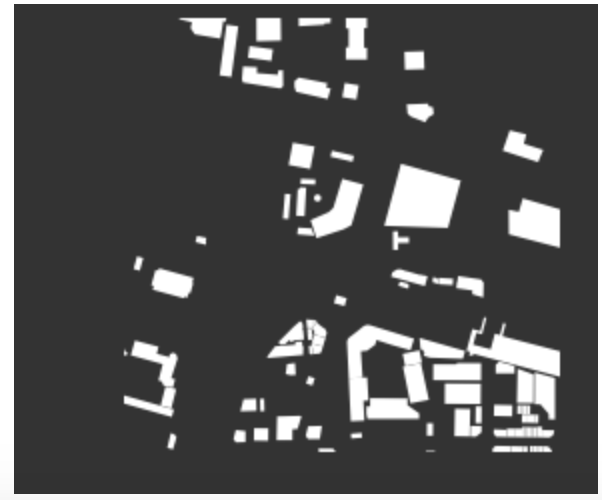
繪圖的部分,還可以加入一些效果
point = (25.048545,121.51123)
dist = 300
gdf = ox.buildings_from_point(point=point, distance=dist)
gdf_proj = ox.project_gdf(gdf)
bbox = ox.bbox_from_point(point=point, distance=dist, project_utm=True)
ox.plot_buildings(gdf_proj, bgcolor='#333333', color='w', figsize=(4,4), bbox=bbox, close=True)
下面網站有一些世界各國城市的某些角落,有興趣的人可以看看!
Urban Form Analysis with OpenStreetMap Data - Geoff Boeing
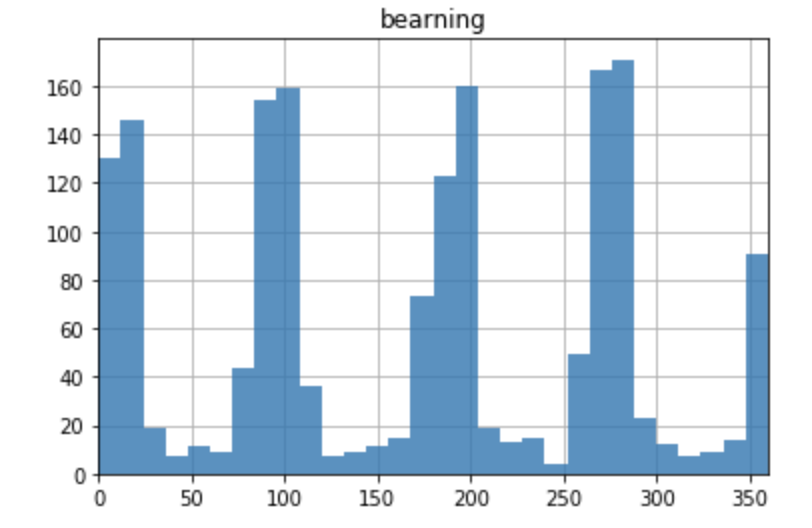
OSMnx有提供一個計算街道方向角的範例,使用add_edge_bearings,而方向角的值域是0-360度,官網也提供一個圖表範例,看起來滿有fu的。
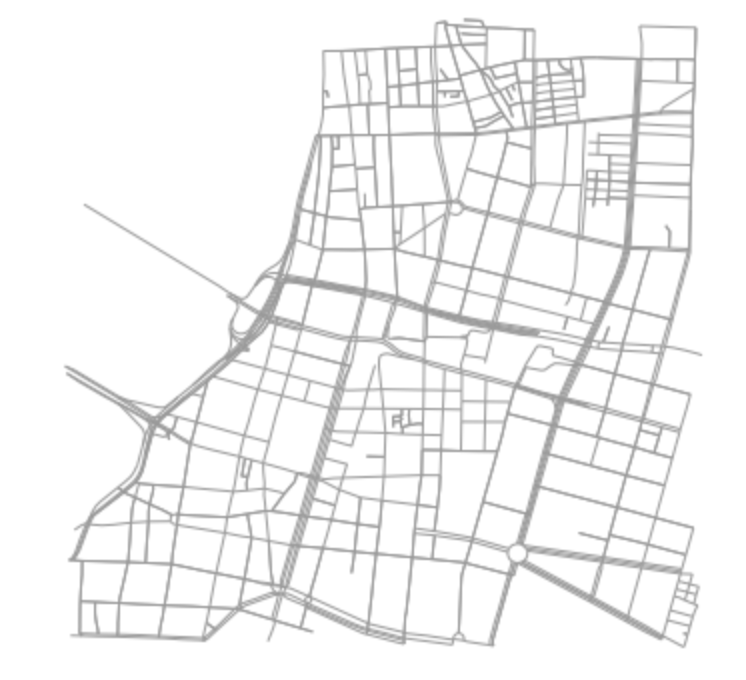
我們就以台北火車站為中心,方圓1.5km,大概就是古台北城的範圍來做範例吧!
台北火車站的坐標大概是25.048545,121.51123,取得資料
G = ox.graph_from_point((25.048545,121.51123), distance=1500, network_type='drive')
fig, ax = ox.plot_graph(ox.project_graph(G), node_size=0)
計算方向角add edge bearings:
G = ox.add_edge_bearings(G)
把方向角整理一下,bar chart
bearings = pd.Series([data['bearing'] for u, v, k, data in G.edges(keys=True, data=True)])
ax = bearings.hist(bins=30, zorder=2, alpha=0.8)
xlim = ax.set_xlim(0, 360)
ax.set_title('bearning')
以雷達圖繪圖
import numpy as np
n = 30
bins = [ang * 360 / n for ang in range(0, n + 1)]
count, division = np.histogram(bearings, bins=bins, range=(bearings.min(), bearings.max()))
division = division[0:-1]
width =  2 * np.pi/n
ax = plt.subplot(111, projection='polar')
ax.set_theta_zero_location('N')
ax.set_theta_direction('clockwise')
bars = ax.bar(division * np.pi/180 - width * 0.5 , count, width=width, bottom=20.0)
ax.set_title('street network edge bearings', y=1.1)
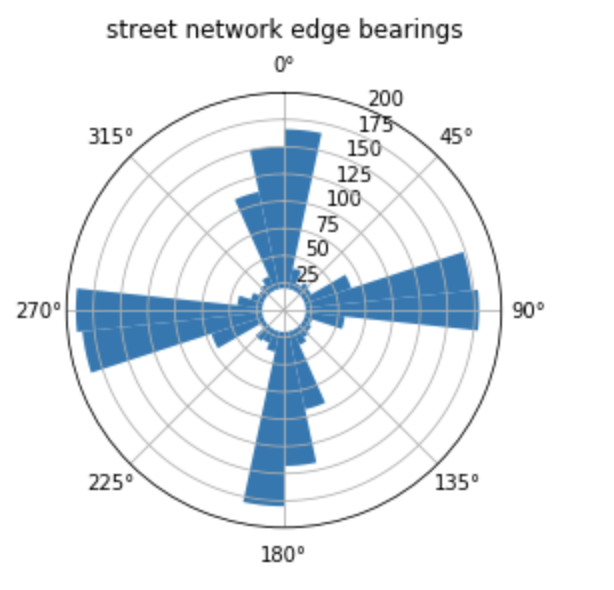
(台北市應該算滿正的)
