因為在網路上沒找到這種長條圖的畫法(至少中文版的沒有哈哈),因此想說在此交流一下。畢竟R語言厲害在繪圖,剛好在工作上最近一直研究ggplot2的長條圖,為了因應各種吹毛求疵需求,研究了一翻,就在這邊與大家交流吧!
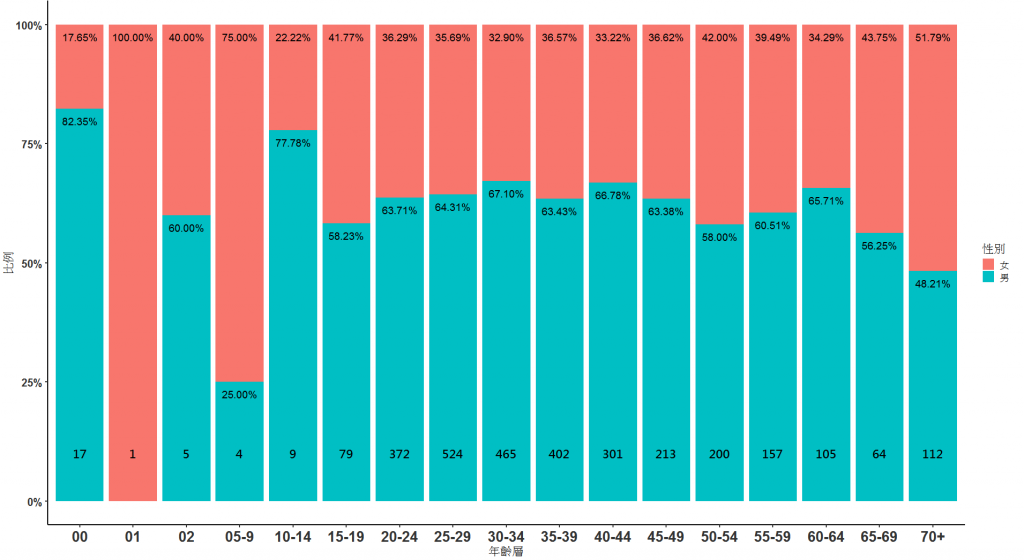
資料的部分就延用昨天的資料集:
library(jsonlite)
library(tidyverse)
data <- fromJSON("https://od.cdc.gov.tw/eic/Weekly_Age_County_Gender_0703.json")
data[,8] = ifelse(nchar(data[,8]) == 1 | grepl("5-9",data[,8])  , paste0("0",(data[,8])), data[,8])
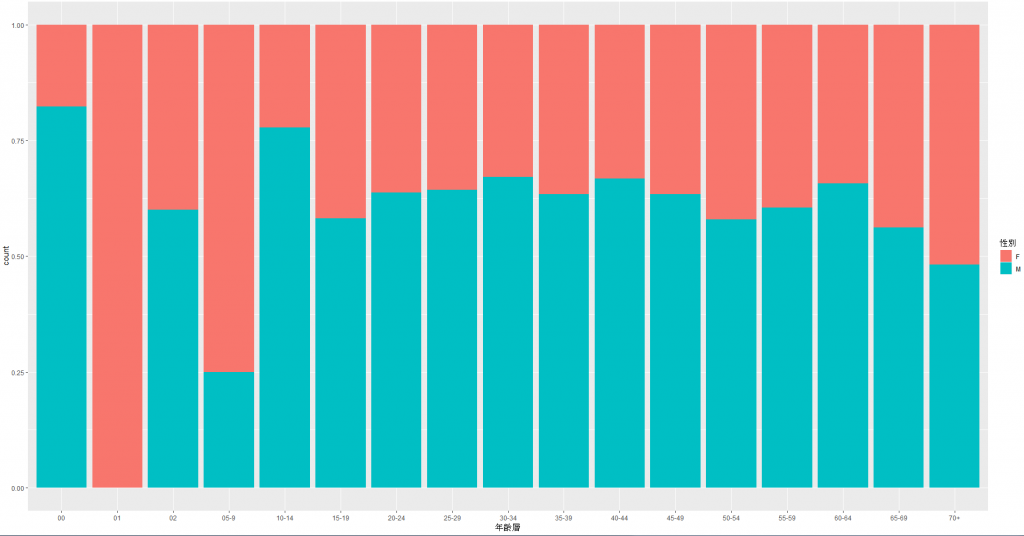
這樣就成功讀取一個data資料集了,是急性病毒性B型肝炎的資料集,我們來看年齡層與性別的關係。
ggplot(data, aes(x = 年齡層, fill = 性別)) +
  geom_bar(position = "fill")
ggplot(data, aes(x = 年齡層, fill = 性別)) +
 geom_bar(position = "fill") +
  labs( y = "次數",size=10) +#改變y軸名稱
  theme(axis.title.y =element_text(hjust = 0.5,color="firebrick4",angle=90,face="bold",size=15,family = "A"))+#Y軸標題
  theme(axis.text.y=element_text(face="bold",size=15,color="#333333"))+##調整y軸字型
  theme(axis.text.x=element_text(face="bold",size=15,angle=360,color="#333333"))+#x軸字型(筆數的數字)
 scale_y_continuous(breaks = c(0,0.25,0.5,0.75,1) ,labels =c("0%","25%","中線","75%","100%"))+#改變y軸承現的文字
  scale_fill_discrete(name="性別",labels=c("男","女"))+#改變右邊的說明格
  geom_hline(yintercept=0.5,linetype="twodash",colour="#0000ff",size = 1) #增加一條中線
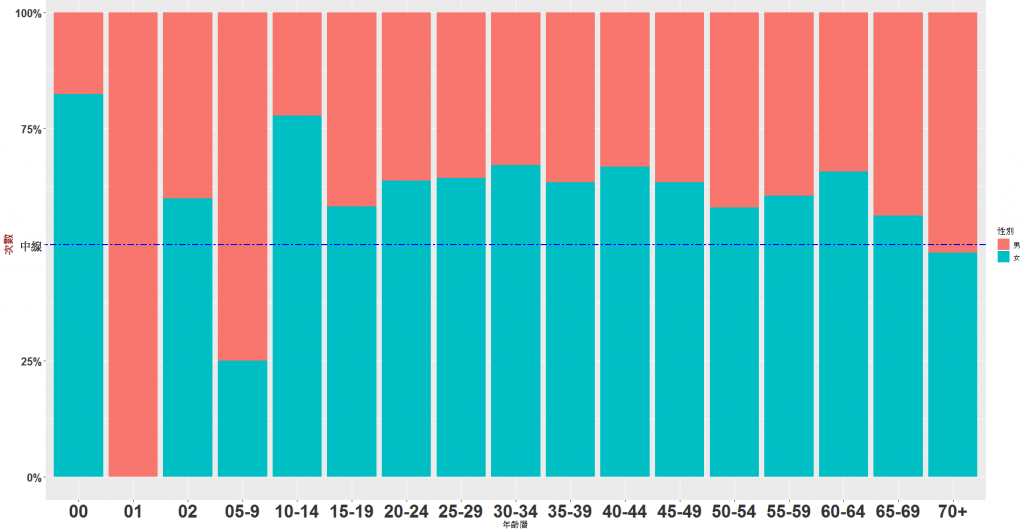
加一些參數之後感覺就有點質感了。
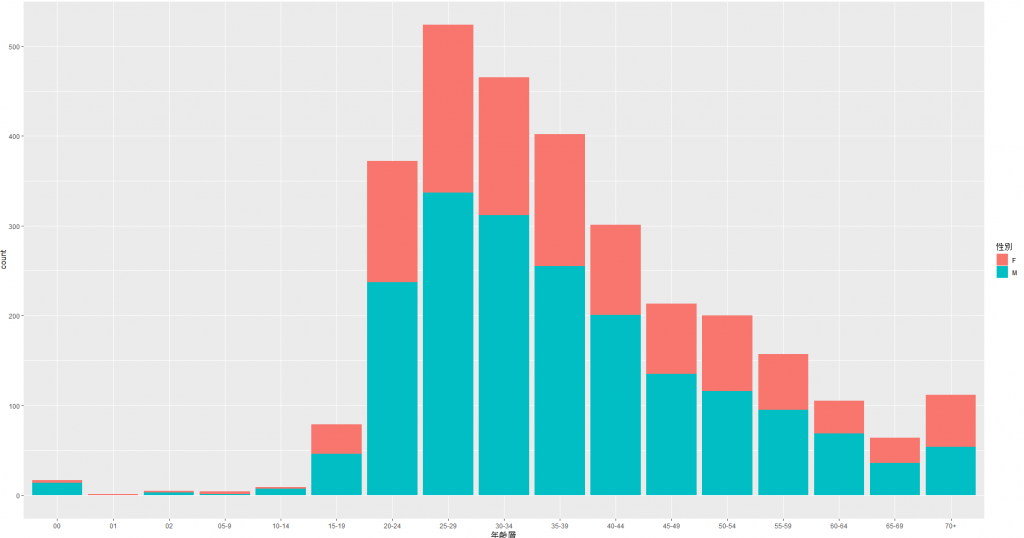
ggplot(data, aes(x = 年齡層, fill = 性別)) +
  geom_bar(position = "stack")
ggplot(data, aes(x = 年齡層, fill = 性別)) +
  geom_bar(position = "dodge")
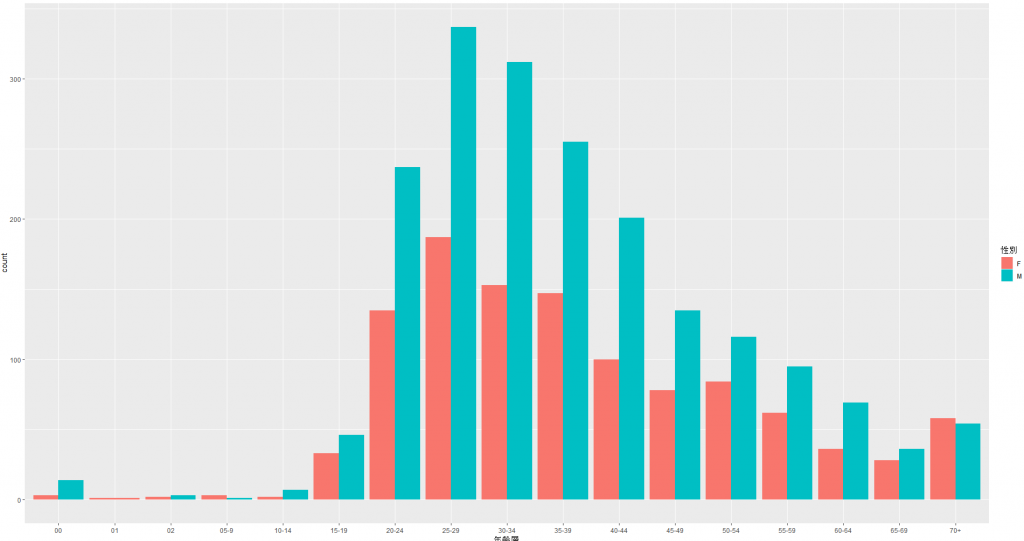
這些屬於基本的,接下來要介紹增加文字的寫法。
library(plyr)
#----統計起來為了做長條圖----#
ess2 = ddply(data,.(年齡層),function(.){
  res = prop.table(table(factor(.$性別)))
  res2 = table(factor(.$性別))
  data.frame(lab=names(res), y=c(res),yy =c(res2))
})
detach("package:plyr", unload=TRUE)


for_show = data %>% group_by(年齡層) %>% summarise(length(年齡層))

windowsFonts(A=windowsFont("微軟正黑體"))
ggplot(ess2,aes(x = 年齡層,y=y,fill = lab))+
  geom_bar(stat = "identity") +
  theme_classic(base_size = 16)+
  geom_text(mapping = aes(label = sprintf("%.2f%%",y*100)),
            size = 5, colour = 'black', vjust = 2, hjust = .5, position = position_stack())+
  annotate('text',x = 1:nrow(for_show),y=0.1,label= unlist(for_show[,2]),family = "A",size = 5.5,fontface =2)+

  theme(axis.text.y=element_text(face="bold",size=15,color="#333333"))+##調整y軸字型
  theme(axis.text.x=element_text(face="bold",size=20,angle=360,color="#333333"))+#x軸字型(筆數的數字)
  scale_y_continuous(breaks = c(0,0.25,0.5,0.75,1) ,labels =c("0%","25%","50%","75%","100%"))+
  scale_fill_discrete(name="性別",labels=c("女","男"))+
  labs( x= "年齡層",y = "比例")
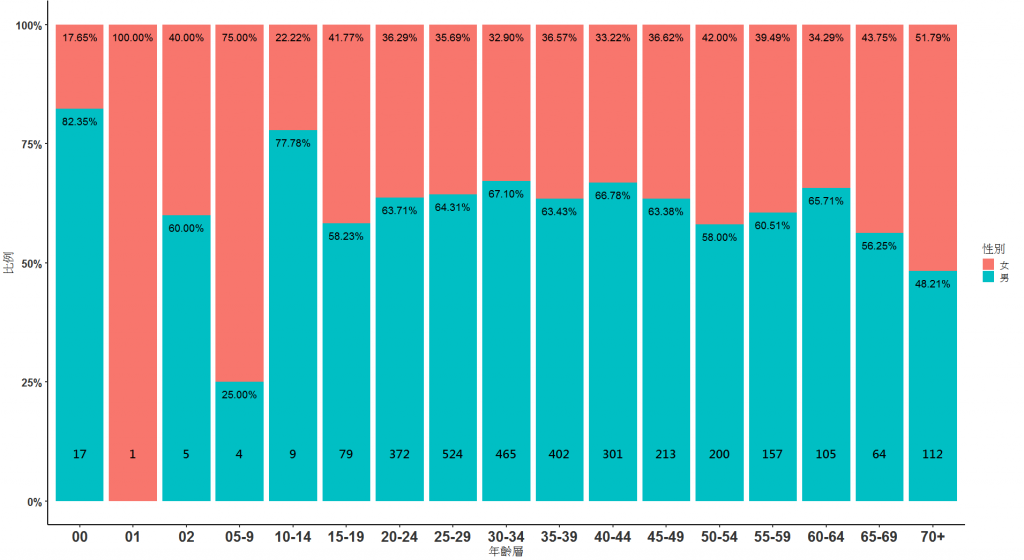
明天也許寫個注解吧。
