EDA (Exploratory Data Analysis) 探索式資料分析
簡單來說,探索式資料分析是運用視覺化或基本統計等工具,來對資料有個初步的認識,以利後續對資料進行複雜或嚴謹的分析。主要能幫助我們認識資料中三個部分:
- 瞭解資料,獲取資料的資訊、結構和特點。
- 檢查有無離群值或異常值,看資料是否有誤。
- 分析各變數間的關聯性,找出重要的變數。
進行EDA能檢查資料是否符合分析前的假設、在模型建立前先發現潛在的錯誤,並進一步調整分析方向。
EDA (Exploratory Data Analysis) uses visualization and basic statistics to get an overview of the data we have, in order to do more complicated and thorough analysis to it. EDA should let us be able to achieve the following three main things:
- To Know the Data - what information does the data provide, the structure of the data, etc.
- Check the Data - if there’s any outliers or unusual value.
- Correlation between Data - find out important variables.
We can also check if the data meet our assumption of it and figure out latent errors before actually building the model, so as to do adjusts for the further analysis.
Graphical Techniques: EDA 4-plot 視覺化:EDA四圖表
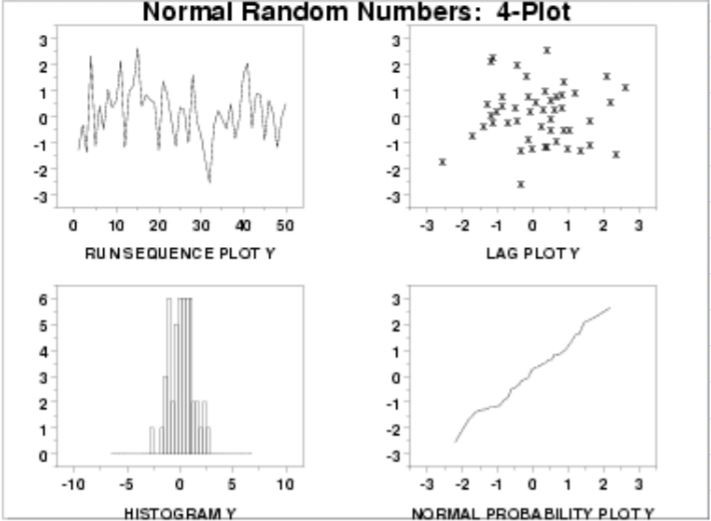
我們可以透過這樣的簡易四圖表(我自己翻譯亂取的XD),對資料分布獲取初步認識:
- 趨勢圖
- 散佈圖 - 資料符合隨機分布時,如圖資料無結構性且隨機散落。
- 直方圖 - 資料常態分布時,如圖呈鐘形分布。
- 正態概率圖 - 資料常態分佈時,如圖呈線性。
We can grasp an intuitive sense of the data through the EDA 4-plot like this:
- Run Sequence Plot.
- Lag Plot - Randomness assumption holds if the lag plot is structureless.
- Histogram - The underlying distribution is perhaps approximately normal if the histogram is bell-shaped.
- Normal Probability Plot - The underlying distribution is approximately normal if the normal probability plot is linear.
Quantitative Techniques 統計量化
透過計算得到單變量的集中趨勢:
We can get the central tendency of a univariate through calculation:
平均值 Mean、中位數 Median、眾數 Mode。
或者計算資料分散程度:
Or to know the measure of dispersion:
最小值 Min、最大值 Max、範圍 Range、四分位差 Quartiles、變異數 Variance、標準差 Standard deviation。
一般而言,EDA能提供我們一些概括性的解答像:
- 資料中標準值為何?
- 資料的百分位數?
- 哪些屬於重要資訊?
- 多變量中有無結構?
- 資料中有沒有離群值?
好的EDA能幫助我們對資料認識,並有助於之後去除離群值、革除雜訊等資料前處理。Pandas中已經有許多寫好的函數,能用以觀察資料,下篇文章會做初步介紹。
Some common questions that exploratory data analysis could be used to answer like:
- What is the typical value?
- What is the percentile?
- What are the most important factors?
- Can we extract any structure from multivariate data?
- Does the data have outliers?
A good EDA helps us gain knowledge of our data (which is very important since we’re going to analyse it later on) and makes it easier for us to remove the outliers, noises, and other data preprocessing. There are many existed functions in Pandas that could help us to observe the data, which will be briefly discussed in the next article.
文中若有錯誤還望不吝指正,感激不盡。
Please let me know if there’s any mistake in this article. Thanks for reading.
Reference 參考資料:
[1] 第二屆機器學習百日馬拉松內容
[2] Engeneering Statistic Handbook
[3] What is Exploratory Data Analysis?
[4] 探索式資料分析簡介


 iThome鐵人賽