還記得去年電信業 499 之亂嗎? 因為中華電信率先推出499元吃到飽,引發手機用戶的板塊大挪移,造成當年所有電信業者EPS大跌。當同業提供的服務大同小異,沒有特色時,客戶的忠誠度是非常低的,價格可能是他們唯一的考量,因此,如何做好客戶關係管理(CRM)就變得非常重要,金融業(銀行、證券...)也是如此,所以,這些行業的行銷人員常常把 Acquisition、Retention、Churn Rate 掛在嘴邊,深怕一個事件造成大量客戶的流失。
客戶的經營有三個階段:
幾年前聽過一場演講,講者提到:
贏得一個新客戶(Acquisition)的成本是留住舊客戶(Retention)成本的 5 倍。
因此,與其不斷的拓展新客源,更重要的是留住舊客戶的心,不要造成客戶流失。所以,我們就來討論一個相關的分析方法 -- 『同類群組分析』(Cohort Analysis)。
何謂同類群組(Cohort)? 簡單的說,就是一群人在特定的時間內有共同的事件發生,例如,在遊戲推廣期間,玩家何時開始玩遊戲,知道第一次玩遊戲的時間點後,接著我們就會問:
同類群組分析(Cohort Analysis)就可以回答上述兩個問題,以下表為例: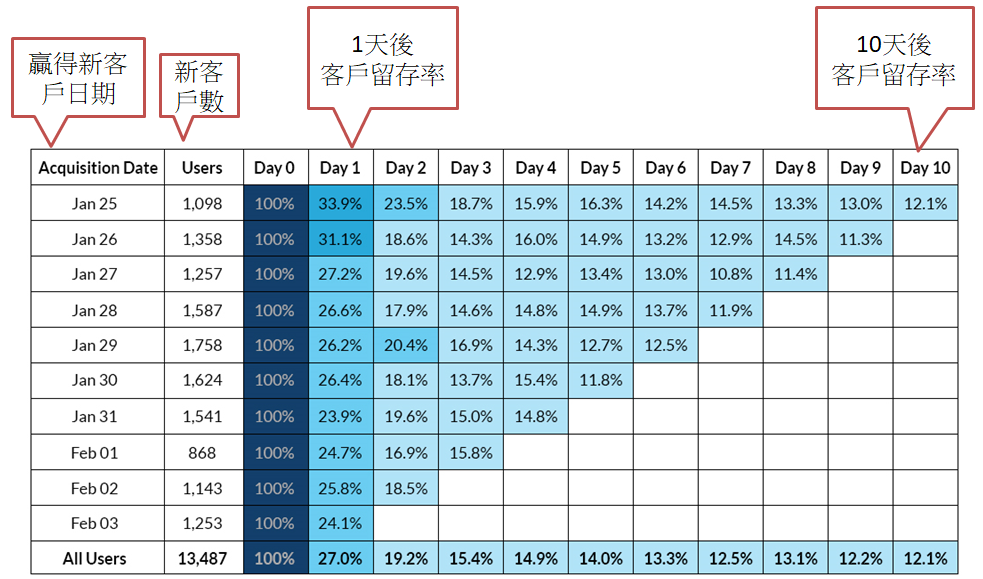
圖片來源:How to Use Cohort Analysis to Improve Customer Retention
上表透露的資訊:
另外,還可以使用不同的視角作同類群組分析(Cohort Analysis),例如,第一欄改為通路,例如手機、Web、實體通路,如下表:
圖片來源:The Definitive Guide to Effective Cohort Analysis
依據上述表格,就很容易進一步計算各通路的『客戶終身價值』(Lifetime Value, LTV)及購買人數的漏斗(Purchase Funnel)。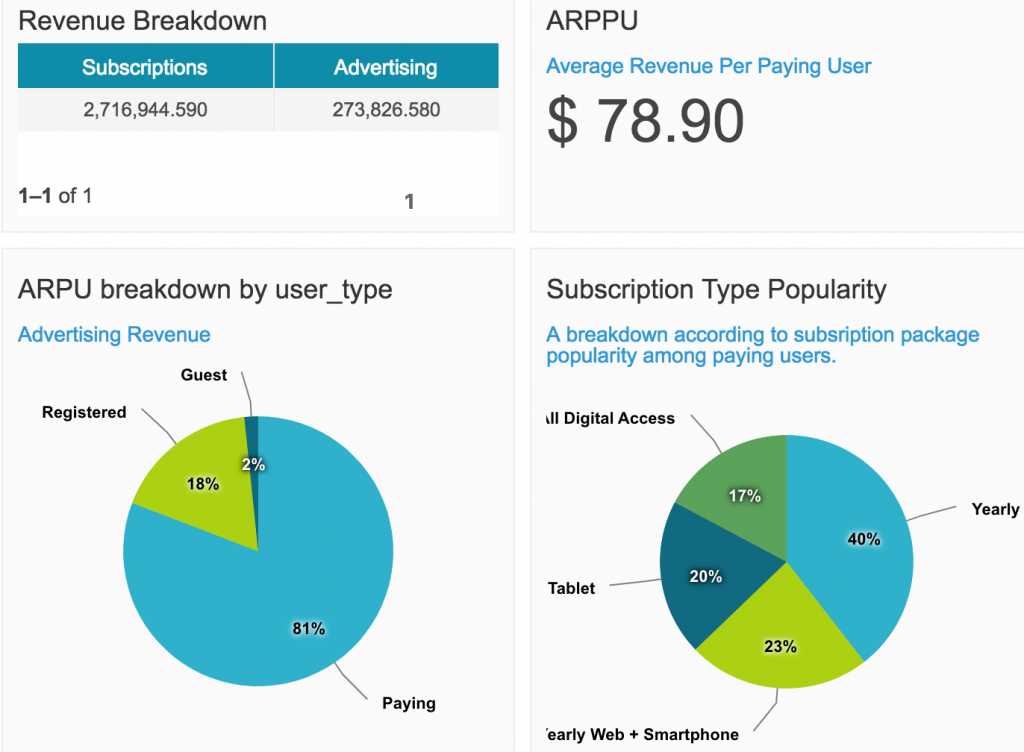
圖. 客戶終身價值(Lifetime Value, LTV)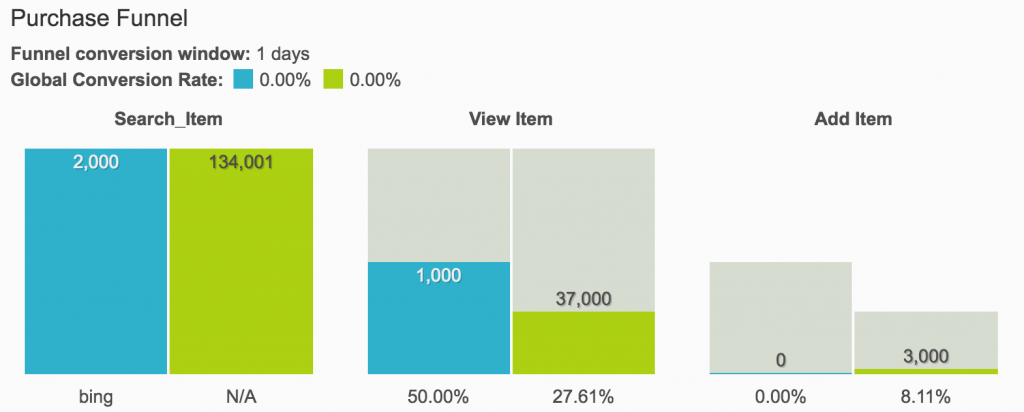
圖. 購買人數的漏斗(Purchase Funnel),圖片來源:The Definitive Guide to Effective Cohort Analysis
有了這些寶貴的資訊後,就可以對症下藥,例如客戶存活的天數過短,就必須加強使用者體驗,給予較多的獎勵,例如寶物,若新客戶人數逐漸減少必須加強廣告或增加促銷活動。
既然這些表這麼有用,如何實作呢? 接下來我們就利用上一篇的資料,產生 Cohort Analysis 表格。
import pandas as pd
import numpy as np
import os
import datetime as dt

df = pd.read_csv("./data.csv",converters={'CustomerID':str})
df['InvoiceDate']=df.InvoiceDate.astype(np.str).str.slice(0,10)
df.InvoiceDate=pd.to_datetime(df.InvoiceDate)
def monthly(x):
    return dt.datetime(x.year, x.month, 1)
df['BillMonth'] = df['InvoiceDate'].apply(monthly)
g = df.groupby('CustomerID')['BillMonth']
df['CohortMonth'] = g.transform('min')
df.head()
def get_int(df, column):
    year = df[column].dt.year
    month = df[column].dt.month
    return year, month

billYear, billMonth = get_int(df, 'BillMonth')
cohortYear, cohortMonth = get_int(df, 'CohortMonth')
diffYear = billYear - cohortYear
diffMonth = billMonth - cohortMonth
df['Month_Index'] = diffYear * 12 + diffMonth + 1
g = df.groupby(['CohortMonth', 'Month_Index'])
cohortData = g['CustomerID'].apply(pd.Series.nunique).reset_index()
cohortCounts = cohortData.pivot(index = 'CohortMonth', columns = 'Month_Index', values = 'CustomerID')
cohortSizes = cohortCounts.iloc[:, 0]
retention = cohortCounts.divide(cohortSizes, axis = 0) * 100
retention.round(2)
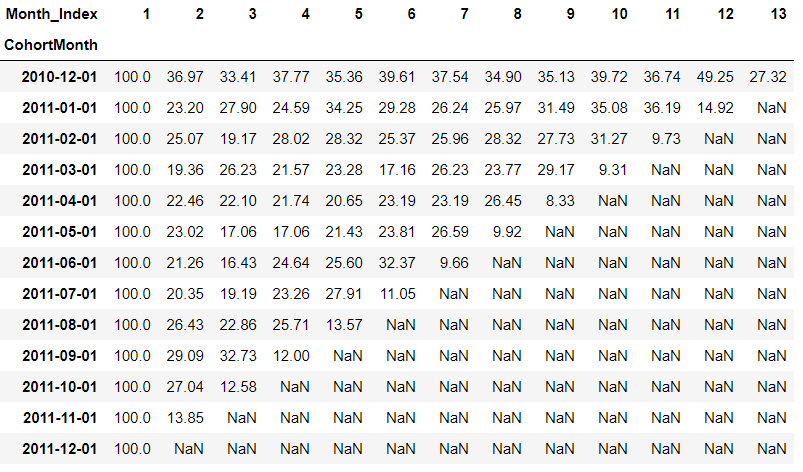
%matplotlib inline
import matplotlib.pyplot as plt
import seaborn as sns

month_list = ["Dec", "Jan", "Feb", "Mar", "Ap", "May", "Jun", "Jul", "Aug", "Sep", "Oct", "Nov", "Dec"]
plt.figure(figsize = (20,10))
plt.title('Retention by Monthly Cohorts')
sns.heatmap(retention.round(2), annot = True, cmap = "Blues", vmax = list(retention.max().sort_values(ascending = False))[1]+3, fmt = '.1f', linewidth = 0.3, yticklabels=month_list)
plt.show()
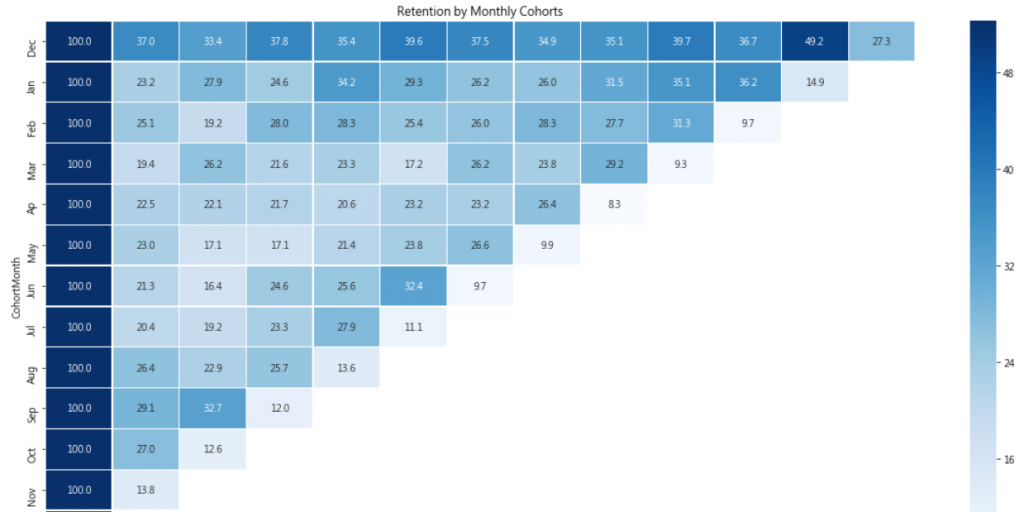
** 以上程式參考『RFM analysis for Customer Segmentation』
Google Analytics 在 2015 年也開始提供此份報表,供使用者分析網站的流量,參考這裡,所以,同類群組分析(Cohort Analysis)的威力可見一般,它的用途如下:
以上參考自甚麼是世代分析?。
相關程式碼放在這裡 的 Day04 Cohort Analysis 目錄。
