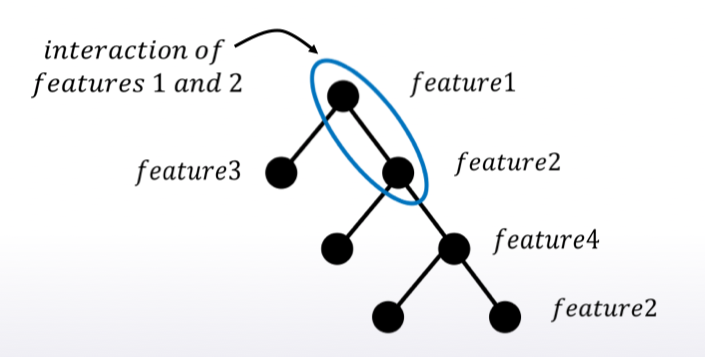
[extra] 老師在這邊說到參賽 Amazon - employee access chanllenge competition 時用 mean encodng 也只有 AUC o.87, 大概是 700 名, 後來用 cat boost model 達到 0.91, 然後就贏了. 但老師提醒 cat boost model 也不是萬能的, 仍須人工處理特徵間互動.
老師手把手 Mean encodings 的筆記本連結在此 :
https://hub.coursera-apps.org/connect/eyusuwbavdctmvzkdnmwro?forceRefresh=false&token=s1i9boL9de22SaUVCfpJ&path=%2Fnotebooks%2FProgramming%2520assignment%252C%2520week%25203%253A%2520Mean%2520encodings%2FProgramming_assignment_week_3.ipynb
若不想去點連結, 下面我也整本 copy 來了
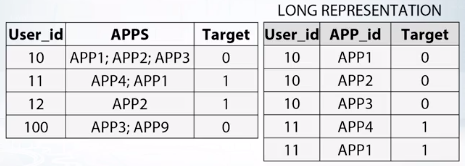
In this programming assignment you will be working with 1C dataset from the final competition. You are asked to encode item_id in 4 different ways:
import pandas as pd
import numpy as np
from itertools import product
from grader import Grader
sales = pd.read_csv('../readonly/final_project_data/sales_train.csv.gz')
Since the competition task is to make a monthly prediction, we need to aggregate the data to montly level before doing any encodings. The following code-cell serves just that purpose.
index_cols = ['shop_id', 'item_id', 'date_block_num']

# For every month we create a grid from all shops/items combinations from that month
grid = []
for block_num in sales['date_block_num'].unique():
    cur_shops = sales[sales['date_block_num']==block_num]['shop_id'].unique()
    cur_items = sales[sales['date_block_num']==block_num]['item_id'].unique()
    grid.append(np.array(list(product(*[cur_shops, cur_items, [block_num]])),dtype='int32'))

#turn the grid into pandas dataframe
grid = pd.DataFrame(np.vstack(grid), columns = index_cols,dtype=np.int32)

#get aggregated values for (shop_id, item_id, month)
gb = sales.groupby(index_cols,as_index=False).agg({'item_cnt_day':{'target':'sum'}})

#fix column names
gb.columns = [col[0] if col[-1]=='' else col[-1] for col in gb.columns.values]
#join aggregated data to the grid
all_data = pd.merge(grid,gb,how='left',on=index_cols).fillna(0)
#sort the data
all_data.sort_values(['date_block_num','shop_id','item_id'],inplace=True)
After we did the techinical work, we are ready to actually mean encode the desired item_id variable.
Here are two ways to implement mean encoding features without any regularization. You can use this code as a starting point to implement regularized techniques.
# Calculate a mapping: {item_id: target_mean}
item_id_target_mean = all_data.groupby('item_id').target.mean()

# In our non-regularized case we just *map* the computed means to the `item_id`'s
all_data['item_target_enc'] = all_data['item_id'].map(item_id_target_mean)

# Fill NaNs
all_data['item_target_enc'].fillna(0.3343, inplace=True)

# Print correlation
encoded_feature = all_data['item_target_enc'].values
print(np.corrcoef(all_data['target'].values, encoded_feature)[0][1])
'''
     Differently to `.target.mean()` function `transform`
   will return a dataframe with an index like in `all_data`.
   Basically this single line of code is equivalent to the first two lines from of Method 1.
'''
all_data['item_target_enc'] = all_data.groupby('item_id')['target'].transform('mean')

# Fill NaNs
all_data['item_target_enc'].fillna(0.3343, inplace=True)

# Print correlation
encoded_feature = all_data['item_target_enc'].values
print(np.corrcoef(all_data['target'].values, encoded_feature)[0][1])
See the printed value? It is the correlation coefficient between the target variable and your new encoded feature. You need to compute correlation coefficient between the encodings, that you will implement and submit those to coursera.
grader = Grader()
Explained starting at 41 sec of Regularization video.
Now it's your turn to write the code!
You may use 'Regularization' video as a reference for all further tasks.
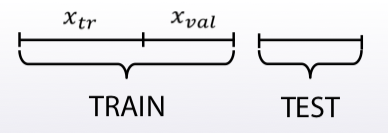
First, implement KFold scheme with five folds. Use KFold(5) from sklearn.model_selection.
Split your data in 5 folds with sklearn.model_selection.KFold with shuffle=False argument.
Iterate through folds: use all but the current fold to calculate mean target for each level item_id, and fill the current fold.
See the Method 1 from the example implementation. In particular learn what map and pd.Series.map functions do. They are pretty handy in many situations.
# YOUR CODE GOES HERE

# You will need to compute correlation like that
corr = np.corrcoef(all_data['target'].values, encoded_feature)[0][1]
print(corr)
grader.submit_tag('KFold_scheme', corr)
Now, implement leave-one-out scheme. Note that if you just simply set the number of folds to the number of samples and run the code from the KFold scheme, you will probably wait for a very long time.
To implement a faster version, note, that to calculate mean target value using all the objects but one given object, you can:
Calculate sum of the target values using all the objects.
Then subtract the target of the given object and divide the resulting value by n_objects - 1.
Note that you do not need to perform 1. for every object. And 2. can be implemented without any for loop.
It is the most convenient to use .transform function as in Method 2.
# YOUR CODE GOES HERE

corr = np.corrcoef(all_data['target'].values, encoded_feature)[0][1]
print(corr)
grader.submit_tag('Leave-one-out_scheme', corr)
Explained starting at 4:03 of Regularization video.
Next, implement smoothing scheme with α=100
. Use the formula from the first slide in the video and 0.3343
as globalmean. Note that nrows is the number of objects that belong to a certain category (not the number of rows in the dataset).
# YOUR CODE GOES HERE

corr = np.corrcoef(all_data['target'].values, encoded_feature)[0][1]
print(corr)
grader.submit_tag('Smoothing_scheme', corr)
Explained starting at 5:50 of Regularization video.
Finally, implement the expanding mean scheme. It is basically already implemented for you in the video, but you can challenge yourself and try to implement it yourself. You will need cumsum and cumcount functions from pandas.
# YOUR CODE GOES HERE

corr = np.corrcoef(all_data['target'].values, encoded_feature)[0][1]
print(corr)
grader.submit_tag('Expanding_mean_scheme', corr)
[來自小宇宙, 無關 coursera 或 kaggle]
基本上, 生統的作業已經遲繳, 只有一樣一樣來, 努力完成 30 天, 白天上班前寫生統作業, 下班後看 coursera 寫鐵人文, 基本上第一天之後的每一天每次寫鐵人文都在跟自己奮戰, 剩 9 天了! hold 住!! 堅持住 !!