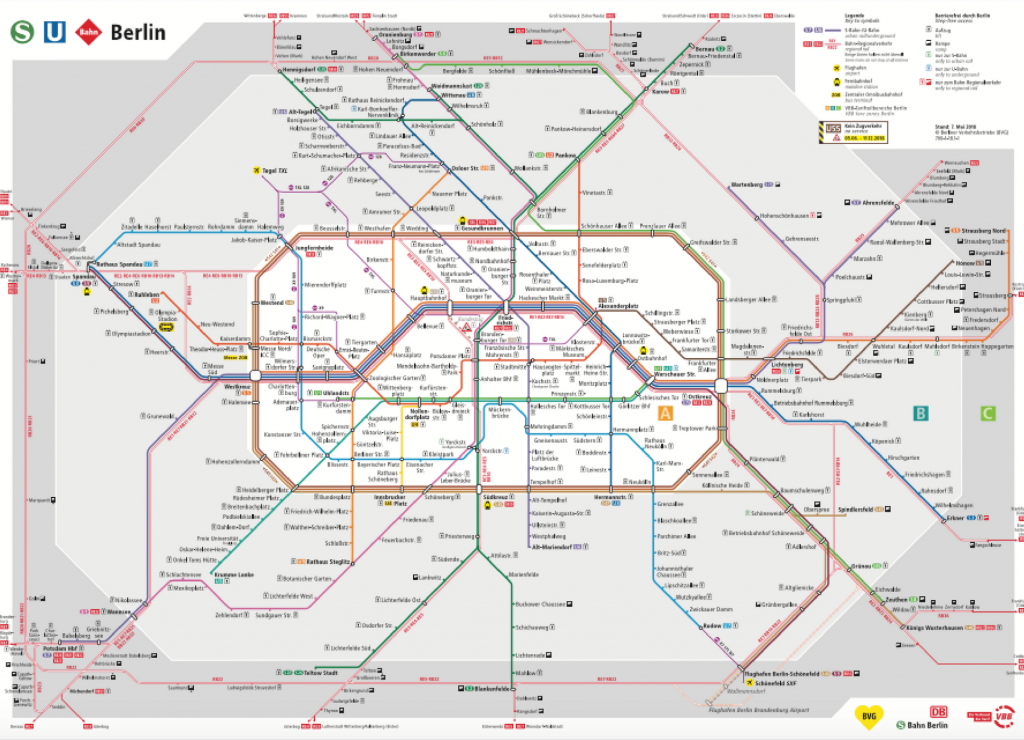
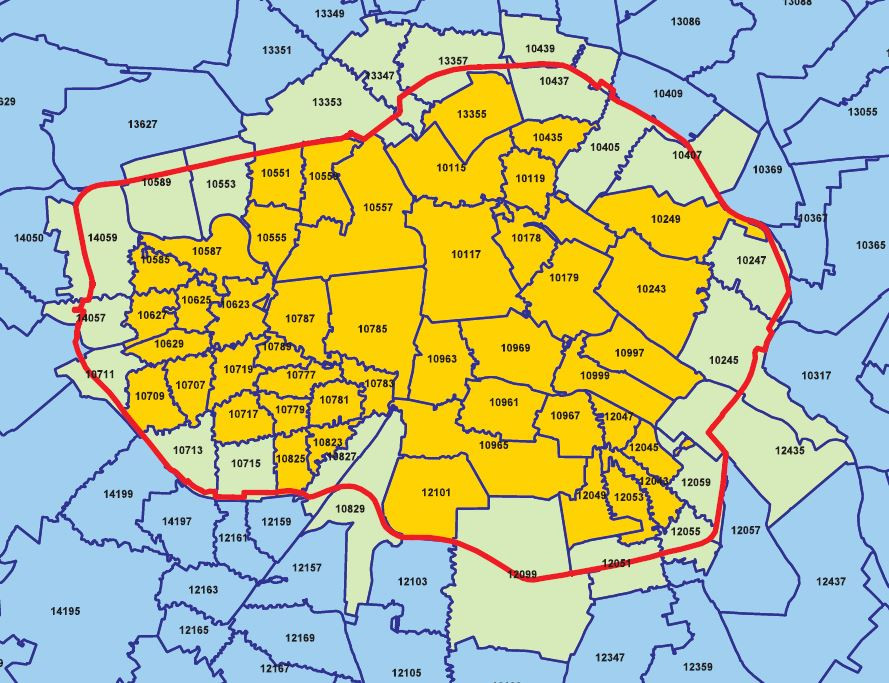
到柏林旅遊,會發現市區交通票券由放射狀分為A、B、C三個區塊,想買長期票券分法只有A+B區、B+C區、A+B+C區,以一般旅遊民眾而言,移動範圍多會在A+B區,網路上沒有找到相關A+B區詳細劃分的資料,但可以這個柏林低排放區為依據,在這個區域的房源交通易達度較高,故只取出這些地區的房源做分析。這個網站由於柏林以大約S-Bahn路面輕軌環狀電車以內規劃為低排放區,姑且就稱之為柏林蛋黃區XD。
The transportation in Berlin is devided into A, B, and C three zones. But if you want to buy a longterm ticket, you can only choose between A+B zone, B+C zone, and A+B+C zone. I couldn't find any data that specify the border of three zones but I found this Low-emission Zone Area instead. The low-emission zone covers the centre of Berlin inside the S-Bahn ring so we will analyse the listings in this area.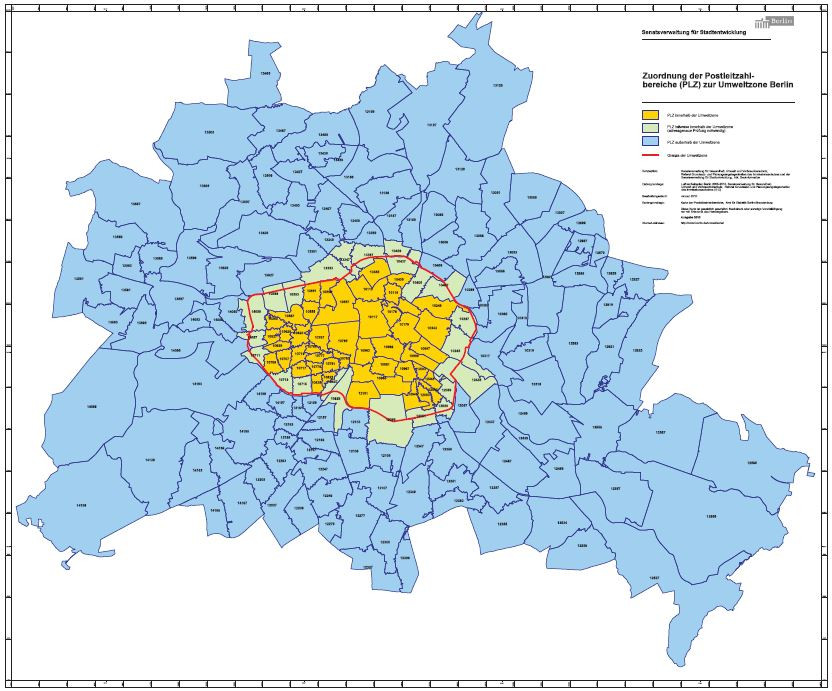
First, we need to import the packeges we need and read in the data we are about to analyse.
# 載入所需套件 import the packages we need
import pandas as pd
import numpy as np
ringzipcode = pd.read_csv('airbnb/ring_zipcode.csv') # 讀入ring_zipcode.csv檔案 read in the ring_zipcode.csv file
ringzipcode.columns = ['zipcode', 'info'] # 改下欄位名 change the name of the columns
ringzipcode.head(10) # 讀取前十筆資料看一下 call the top 10 rows to take a look
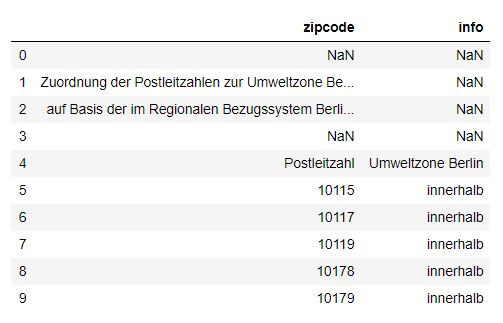
ringzipcode = np.array(ringzipcode)
ringzipcode_list = ringzipcode.tolist()
print(ringzipcode_list[:10]) # 印出前10筆看看 print out the top 10 list

# 我們只要存整個區域在環狀輕軌電車內的郵遞區號 we only want the postcode of areas that's in the S-Bahn ring
rz = []
for i in ringzipcode_list:
    if i[1] == 'innerhalb':
        rz.append(i[0])
print(rz)

import warnings # 忽略警告訊息
warnings.filterwarnings("ignore")
# 讀入listing檔案來分析 Read in the listing file
listing = pd.read_csv('airbnb/listings.csv') # 讀入listing檔案來分析 read in the listing file
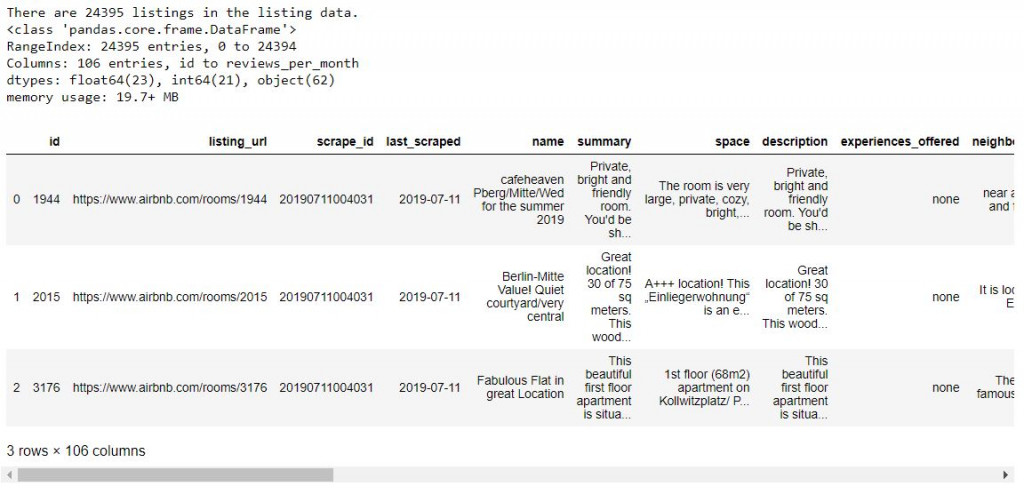
print('There are', listing.id.nunique(), 'listings in the listing data.')
listing.info() # 查看資料細節 the info of data
listing.head(3) # 叫出前三筆資料看看 print out the top three rows of data
abzone = listing["zipcode"].isin(rz)
ablisting = listing[abzone]
ablisting.info()
print('篩過郵遞區號後少了一半以上的房源數量。')
print('The listing counts become less than a half after filtered with postcode in the S-Bahn ring area.')

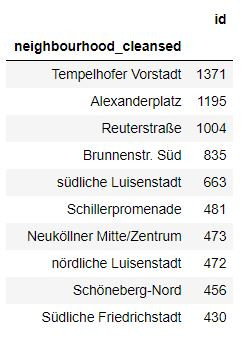
# 篩選後數量前10名不一樣了,沒想到有些偏遠地區房源數量很多
# top 10 listings changed after filtering, didn't know that there were many listings in the regional area.
grouped_ab_df = ablisting.groupby('neighbourhood_cleansed').count()[['id']].sort_values('id', ascending=False).head(10)
grouped_ab_df
grouped_ab_df.index

# 房源數量前10的區域 The areas with the top 10 listings
top10 = []
for i in range(10):
    top10.append(grouped_ab_df.index[i])
print(top10)

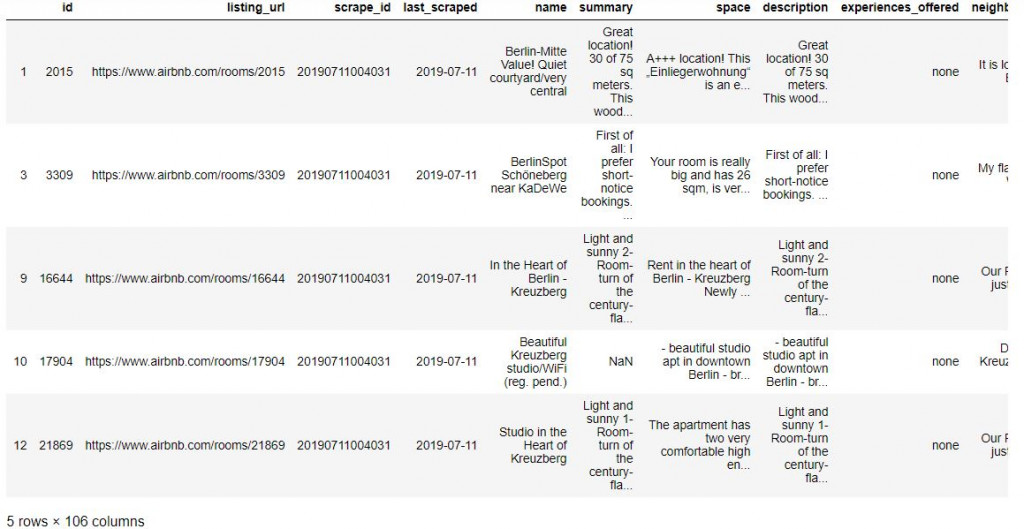
ablisting_iftop10 = ablisting["neighbourhood_cleansed"].isin(top10)
ab_top10_listing = ablisting[ablisting_iftop10]
ab_top10_listing.info()

ab_top10_listing.head()
# 把位於蛋黃區房源數量前10名的存成一個新的csv檔,明天來好好分析
# save the top 10 listings areas within the low-emission zone for further analysis
ab_top10_listing.to_csv('ab_top10_listing.csv')
本篇程式碼與範例檔案請參考Github。The code and example files are available on Github.
文中若有錯誤還望不吝指正,感激不盡。
Please let me know if there’s any mistake in this article. Thanks for reading.
Reference 參考資料:
[1] Inside Airbnb
[2] 利用Airbnb來更了解居住城市,以臺北為例 Python實作(上)
[5] How To Use The Berlin Public Transport Without A Fine
