
昨日(Day22)的文章中,先以低排放區郵遞區號篩選取出房源列表後排序,取房源數量最多的前十名(主要是柏林占地太大,Airbnb上劃分成了133個區,加上交通因素考量,僅取中間環狀輕軌電車內區域做分析),儲存成ab_top10_listing.csv。由原先24395降至7380筆,數量依舊可觀。今天來稍微看一下昨日存的資料樣貌。
In last article we used the postcode of the low-emission zone as a filter to get the listings within the S-Bahn ring zone. Then we sort and save only the listings with the top 10 amount as ab_top10_listing.csv. The listing went from 24395 to 7380, which is still a large amount of data. Today we will then walk through the data to have a look at it.
# 載入所需套件 import the packages we need
import pandas as pd
import numpy as np
import matplotlib.pyplot as plt
import seaborn as sns
import plotly as py

import warnings # 忽略警告訊息
warnings.filterwarnings("ignore")
Read in the file
toplist = pd.read_csv('ab_top10_listing.csv') # 讀入昨天存的檔案來分析 read in the file we created yesterday
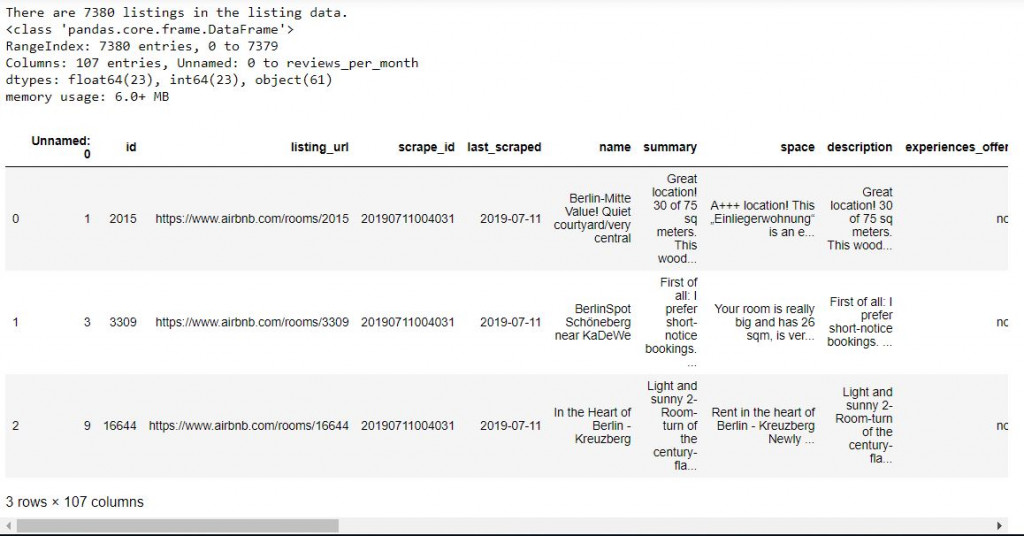
print('There are', toplist.id.nunique(), 'listings in the listing data.')
toplist.info() # 查看資料細節 the info of data
toplist.head(3) # 叫出前三筆資料看看 print out the top three rows of data
Check out the price range of listings
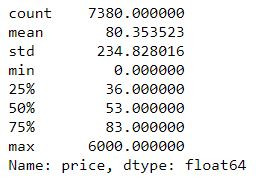
toplist['price'] = toplist['price'].astype(str).str.replace(',', '').astype(str).str.replace('$', '').astype(float)
print(toplist.price.describe()) # 印出一些價格分布數值 get an intuition of what the data look like
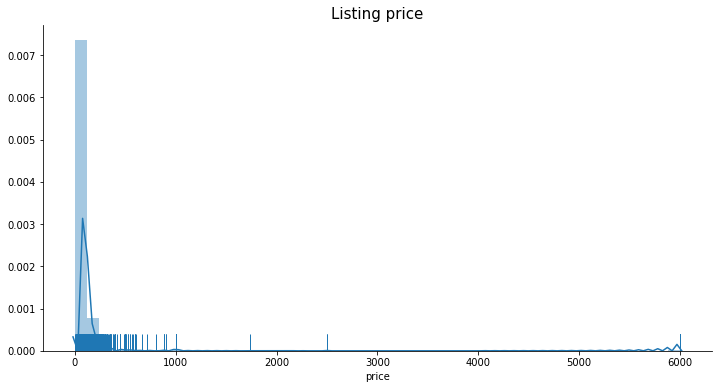
plt.figure(figsize = (12, 6))
plt.title('Listing price', fontsize=15)
sns.distplot(toplist.price.dropna(), rug=True)
sns.despine()
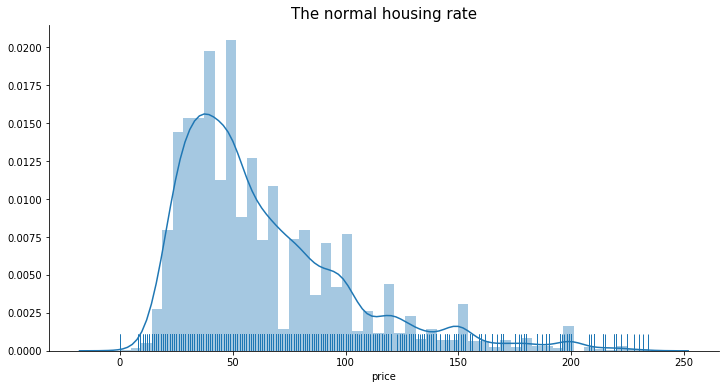
Plot without outliers
# 去除離群值 plot without outliers
# 只取標準差價格以內的房源 only use the price that's below the std
plt.figure(figsize=(12 , 6))
plt.title('The normal housing rate', fontsize=15)
sns.distplot(toplist[toplist.price<235].price.dropna(), rug=True)
sns.despine()
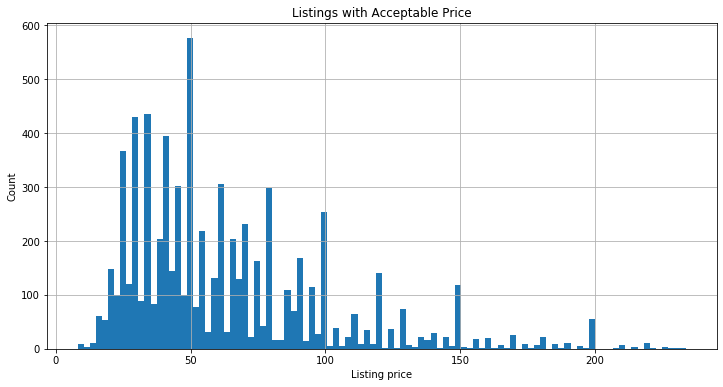
Plot out the price under std
# 取標準差以下價位區間的資料 plot out the price under std
plt.figure(figsize=(12,6))
toplist.loc[(toplist.price<235)&(toplist.price>0)].price.hist(bins=100)
plt.ylabel('Count')
plt.xlabel('Listing price')
plt.title('Listings with Acceptable Price')
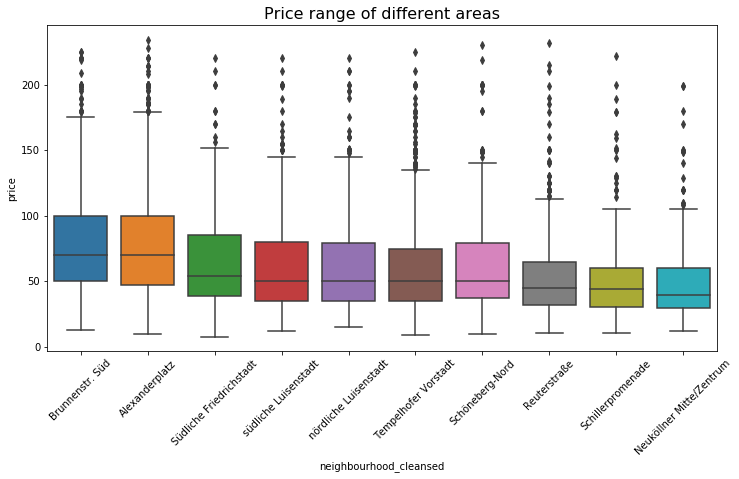
Plot out price range of different areas
drop_outlier_price_condition = toplist.loc[(toplist.price<=234)&(toplist.price>0)]
sort_price = drop_outlier_price_condition\
        .groupby('neighbourhood_cleansed')['price']\
        .median()\
        .sort_values(ascending=False)\
        .index

plt.figure(figsize=(12,6))
plt.title('Price range of different areas', fontsize=16)
sns.boxplot(y='price', x='neighbourhood_cleansed', data=drop_outlier_price_condition, order=sort_price)
plt.xticks(rotation=45)
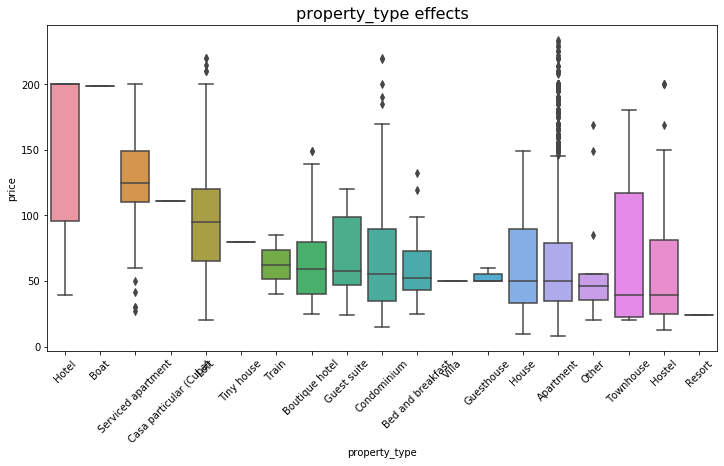
The relation between different property types and price
def boxplot_to_price(category_name):
    sort_price = drop_outlier_price_condition\
                .groupby(category_name)['price']\
                .median()\
                .sort_values(ascending=False)\
                .index
    plt.figure(figsize=(12,6))
    plt.title(category_name +' effects', fontsize=16)
    sns.boxplot(y='price', x=category_name, data=drop_outlier_price_condition, order=sort_price)
    plt.xticks(rotation=45)
boxplot_to_price('property_type')
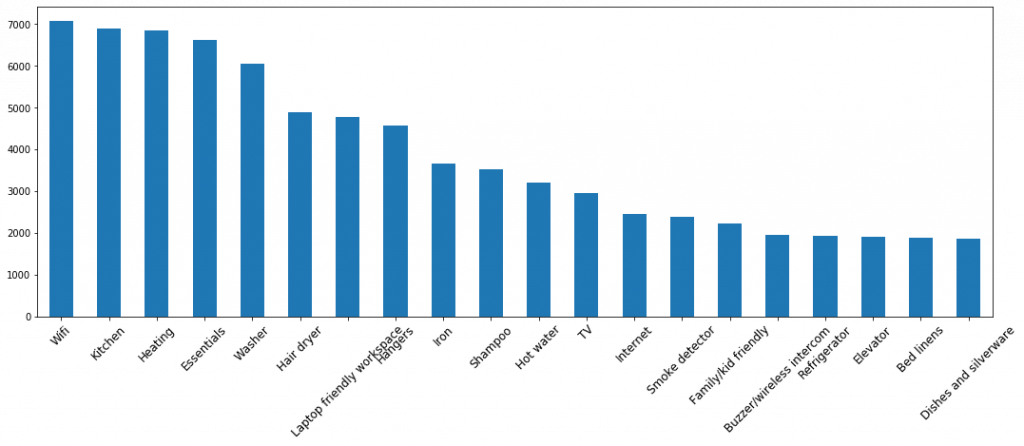
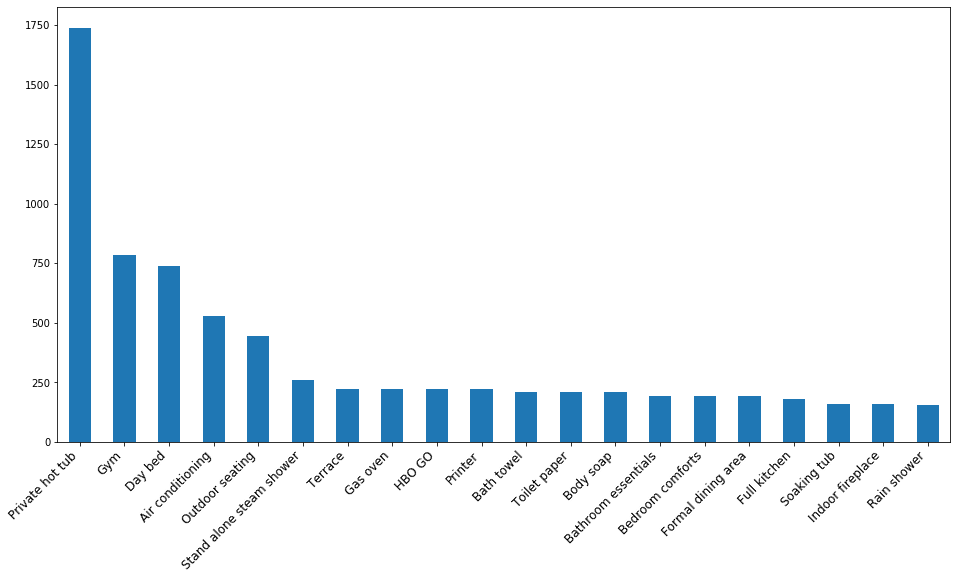
The top 20 amenities listings contain
toplist['amenities'] = toplist.amenities.str.replace('[{}]', '').str.replace('"', '')
toplist.amenities.head()
all_item_ls = np.concatenate(toplist.amenities.map(lambda am:am.split(',')))
Top20_item = pd.Series(all_item_ls).value_counts().head(20)
plt.figure(figsize=(18 , 6))
Top20_item.plot(kind='bar')
plt.xticks(rotation=45, fontsize=12)
The bottom 20 amenities listings contain
amenities = np.unique(np.concatenate(toplist['amenities'].map(lambda amns: amns.split(","))))
amenity_prices = [(amn, toplist[toplist['amenities'].map(lambda amns: amn in amns)]['price'].mean()) for amn in amenities if amn != ""]
amenity_srs = pd.Series(data=[a[1] for a in amenity_prices], index=[a[0] for a in amenity_prices])
plt.figure(figsize=(16,8))
amenity_srs.sort_values(ascending=False)[:20].plot(kind='bar')
ax = plt.gca()
ax.set_xticklabels(ax.get_xticklabels(), rotation=45, ha='right', fontsize=12)
plt.show()
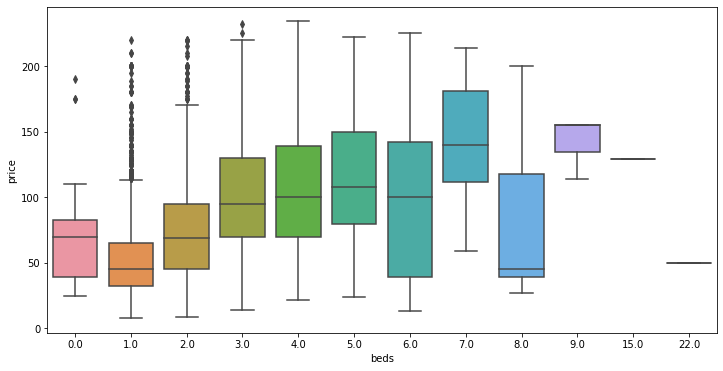
The relation between nembers of beds and price.
plt.figure(figsize=(12,6))
sns.boxplot(y='price', x='beds', data=drop_outlier_price_condition)
plt.show()
# 只取想要的欄位存成新的檔案明天來看 Save only the columns wanted for tomorrow's analysis
df = drop_outlier_price_condition[['id','name','summary','space','description','host_id','host_name','host_location','host_about','host_is_superhost','neighbourhood_group_cleansed','city','state','zipcode','market','latitude','longitude','property_type','room_type','accommodates','bathrooms','bedrooms','beds','bed_type','amenities','square_feet','price']]
df.to_csv('drop.csv')
本篇程式碼請參考Github。The code is available on Github.
文中若有錯誤還望不吝指正,感激不盡。
Please let me know if there’s any mistake in this article. Thanks for reading.
Reference 參考資料:
[1] Inside Airbnb
[2] 利用Airbnb來更了解居住城市,以臺北為例 Python實作(上)

 iThome鐵人賽