介紹
之前我們在做二元分類的時候有介紹幾種模型,perceptron,linear classification。這邊我們要介紹另一種更好懂得模型,決策樹(Decision Tree),顧名思義就是詢問一些問題來分割數據。這個模型有多好懂呢?看了下面的圖片你大概就懂了。
如何做分類
決策樹是透過training data的fearture(例如上圖的Eat pizza, Exercise),學出一系列的問題,然後來推斷其分類。
一開始會先從根節點(父節點)開始,然後依據各個feature將資料作分割到左右兩邊。為了能在節點上,使用最具意義的特徵來做分割,需要透過信息增益(information gain)來判斷。簡單來說, 信息增益大的話那麼這個特徵對於分類來說很重要,很關鍵的一切,就能把數據分得很乾淨, 決策樹就是這樣來找特徵的。
所以在決策樹算法的學習過程中,信息增益是特徵選擇的一個重要指標,它定義為一個特徵能夠為分類系統帶來多少信息,帶來的信息越多,說明該特徵越重要,相應的信息增益也就越大。

上面的式子,f代表節點用來作分割的feature,Dp、Dj分別代表父節點及第j個子節點的資料,Np、Nj分別代表父節點及第j個子節點的資料數量。這裡有一個比較重要的參數,I代表不純度(impurity measure),可以把它想成是分類完整的程度,從式子可以看得出來,如果子節點的I總和越小,代表分割越乾淨,所以信息增益(IG)也就越大。
其中最常見的不純度有三種:
Gini 不純度(Gini impurity): p(i|t)代表在某個節點t,屬於類別c的比例。
熵(entropy): 不確定性的多少,假如在做二元分類時,如果p(i=1|t) = 1或p(i=0|t) = 0
分類錯誤率(classification error):
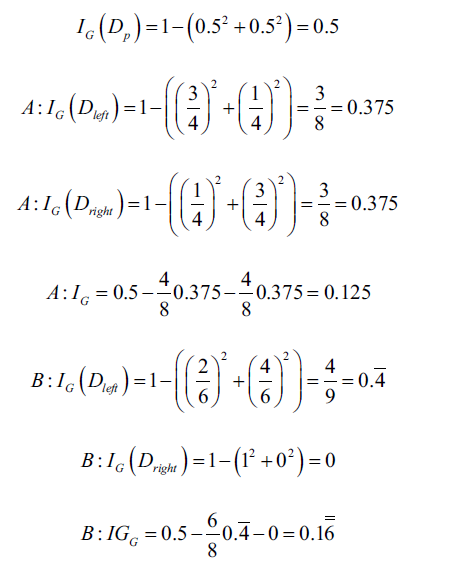
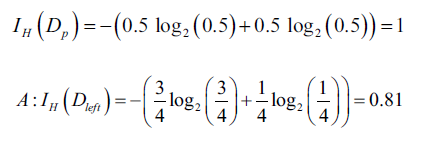
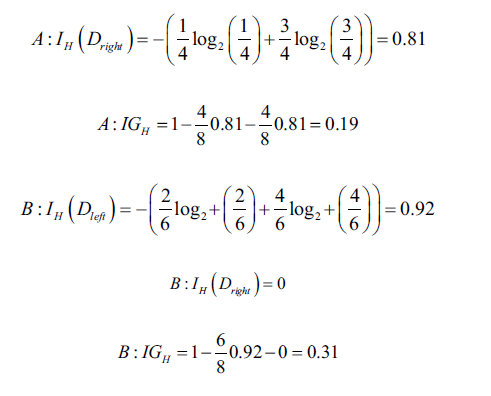
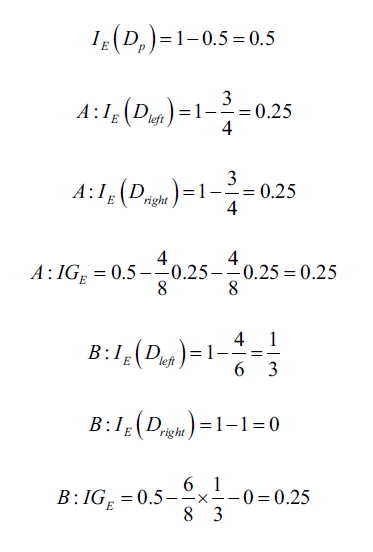
下面是以上面提到的三種不同不純度,對A、B做分析(可以代入上面的公式推導):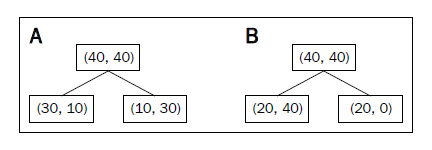
鳶尾花數據實作
import numpy as np
import matplotlib.pyplot as plt
from sklearn import datasets, metrics
from sklearn.tree import DecisionTreeClassifier, DecisionTreeRegressor
from sklearn.model_selection import train_test_split
from matplotlib.colors import ListedColormap


def plot_decision_regions(X, y, classifier, test_idx=None, resolution=0.02):
    # setup markers generator and color map
    markers = ('s', 'x', 'o', '^', 'v')
    colors = ('red', 'blue', 'lightgreen', 'gray', 'cyan')
    cmap = ListedColormap(colors[:len(np.unique(y))])

    # plot the decision surface
    x1_min, x1_max = X[:, 0].min() - 1, X[:, 0].max() + 1
    x2_min, x2_max = X[:, 1].min() - 1, X[:, 1].max() + 1
    xx1, xx2 =  np.meshgrid(np.arange(x1_min, x1_max, resolution), np.arange(x2_min, x2_max, resolution))

    z = classifier.predict(np.array([xx1.ravel(), xx2.ravel()]).T)
    z = z.reshape(xx1.shape)
    plt.contourf(xx1, xx2, z, alpha=0.4, cmap=cmap)
    plt.xlim(xx1.min(), xx1.max())
    plt.ylim(xx2.min(), xx2.max())

    # plot all samples
    X_test, y_test = X[test_idx, :], y[test_idx]
    for idx, cl in enumerate(np.unique(y)):
        plt.scatter(x=X[y==cl, 0], y=X[y==cl, 1], alpha=0.8, c=cmap(idx), marker=markers[idx], label=cl)

    # hightlight test samples
    if test_idx:
        X_test, y_test = X[test_idx, :], y[test_idx]
        plt.scatter(X_test[:, 0], X_test[:, 1], c='', alpha=1.0, linewidth=1, marker='o', s=55, label='test set')


def main():
  iris = datasets.load_iris()
  x_train, x_test, y_train, y_test = train_test_split(iris.data[:, [2, 3]], iris.target, test_size=0.25, random_state=4)
  clf = DecisionTreeClassifier(criterion='entropy', max_depth=3, random_state=0)
  clf.fit(x_train, y_train)
  y_pred = clf.predict(x_test)

  X_combined = np.vstack((x_train, x_test))
  y_combined = np.hstack((y_train, y_test))

  plot_decision_regions(X_combined, y_combined, classifier=clf)
  plt.xlabel('petal length [cm]')
  plt.ylabel('petal width [cm]')
  plt.legend(loc='upper left')
  plt.show()


if __name__ == '__main__':
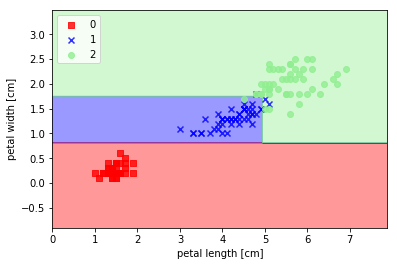
  main()
