介紹
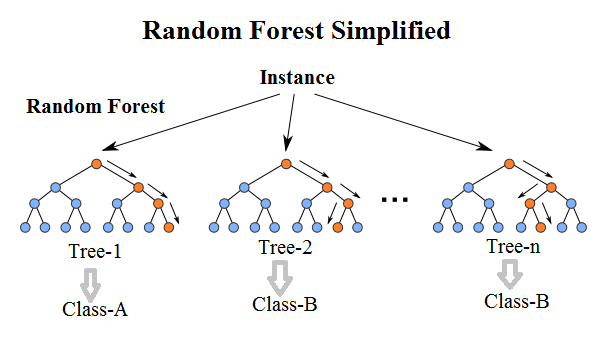
Random Forest的基本原理是,結合多顆CART樹(CART樹為使用GINI算法的決策樹),並加入隨機分配的訓練資料,以大幅增進最終的運算結果。顧名思義就是由許多不同的決策樹所組成的一個學習器,其想法就是結合多個「弱學習器」來建構一個更強的模型:「強學習器」。這種方法又稱為Ensemble Method,也就是「三個臭皮匠勝過一個諸葛亮」的概念。
不過我們只有一個數據集,所以要形成多顆具差異性的樹以進行Ensemble Method,就是要產生不同的數據集,才能產生多顆具差異性的CART樹,其作法有兩種方式:
Bagging(Bootstrap Aggregation): Bootstrap指的是「重新取樣原有Data產生新的Data,取樣的過程是均勻且可以重複取樣的」,使用Bootstrap我們就可以從一組Data中生出多組Dataset。此種方法會從Training dataset中取出K個樣本,再從這K個樣本訓練出K個分類器(在此為tree)。每次取出的K個樣本皆會再放回母體,因此這個K個樣本之間會有部份資料重複,不過由於每顆樹的樣本還是不同,因此訓練出的分類器(樹)之間是具有差異性的,而每個分類器的權重一致最後用投票方式(Majority vote)得到最終結果。
Boosting: 與Bagging類似,但更強調對錯誤部份加強學習以提升整體的效率。是透過將舊分類器的錯誤資料權重提高,加重對錯誤部分的練習,訓練出新的分類器,這樣新的分類器就會學習到錯誤分類資料(misclassified data)的特性,進而提升分類結果。就好像在學校考試時,面臨大型考試前都會加強比較弱的部分或是把之前考試時錯誤的題目再多練習幾次。
所以大概可以猜想得出來:
Random Forest = Bagging + Decision Tree
步驟
鳶尾花數據實作
import matplotlib.pyplot as plt
import numpy as np
from matplotlib.colors import ListedColormap
from sklearn import datasets, metrics
from sklearn.ensemble import RandomForestClassifier
from sklearn.model_selection import train_test_split
def plot_decision_regions(X, y, classifier, test_idx=None, resolution=0.02):
# setup markers generator and color map
markers = ('s', 'x', 'o', '^', 'v')
colors = ('red', 'blue', 'lightgreen', 'gray', 'cyan')
cmap = ListedColormap(colors[:len(np.unique(y))])
# plot the decision surface
x1_min, x1_max = X[:, 0].min() - 1, X[:, 0].max() + 1
x2_min, x2_max = X[:, 1].min() - 1, X[:, 1].max() + 1
xx1, xx2 = np.meshgrid(np.arange(x1_min, x1_max, resolution), np.arange(x2_min, x2_max, resolution))
z = classifier.predict(np.array([xx1.ravel(), xx2.ravel()]).T)
z = z.reshape(xx1.shape)
plt.contourf(xx1, xx2, z, alpha=0.4, cmap=cmap)
plt.xlim(xx1.min(), xx1.max())
plt.ylim(xx2.min(), xx2.max())
# plot all samples
X_test, y_test = X[test_idx, :], y[test_idx]
for idx, cl in enumerate(np.unique(y)):
plt.scatter(x=X[y==cl, 0], y=X[y==cl, 1], alpha=0.8, c=cmap(idx), marker=markers[idx], label=cl)
# hightlight test samples
if test_idx:
X_test, y_test = X[test_idx, :], y[test_idx]
plt.scatter(X_test[:, 0], X_test[:, 1], c='', alpha=1.0, linewidth=1, marker='o', s=55, label='test set')
def main():
iris = datasets.load_iris()
x_train, x_test, y_train, y_test = train_test_split(iris.data[:, [2, 3]], iris.target, test_size=0.25, random_state=4)
clf = RandomForestClassifier(n_estimators=20, max_depth=4)
clf.fit(x_train, y_train)
y_pred = clf.predict(x_test)
X_combined = np.vstack((x_train, x_test))
y_combined = np.hstack((y_train, y_test))
plot_decision_regions(X_combined, y_combined, classifier=clf, test_idx=range(105, 150))
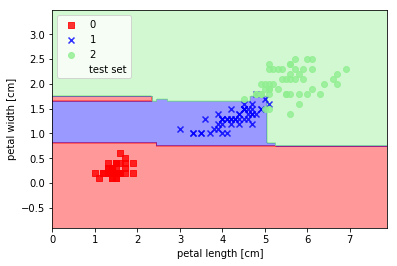
plt.xlabel('petal length [cm]')
plt.ylabel('petal width [cm]')
plt.legend(loc='upper left')
plt.show()
if __name__ == '__main__':
main()


 iThome鐵人賽