iT邦幫忙

第 12 屆 iThome 鐵人賽

DAY 3
0

機率模式 (Probabilistic Model)

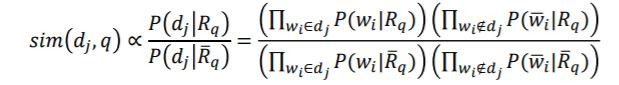
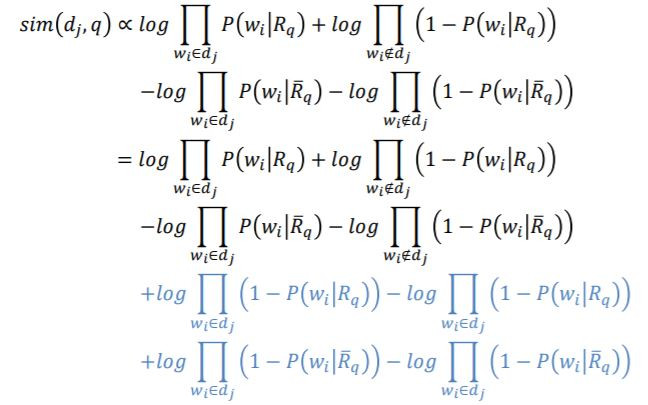
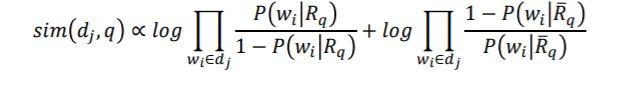
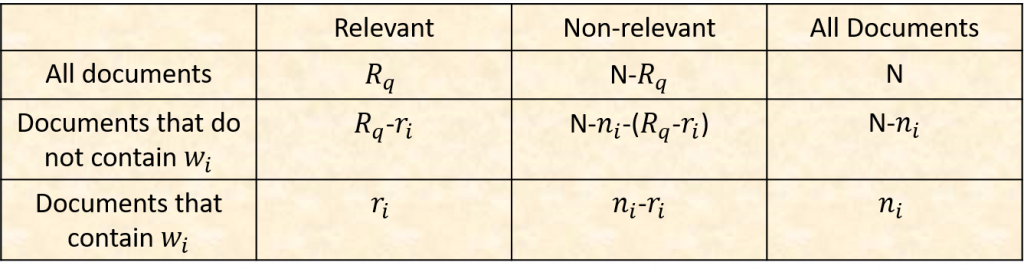
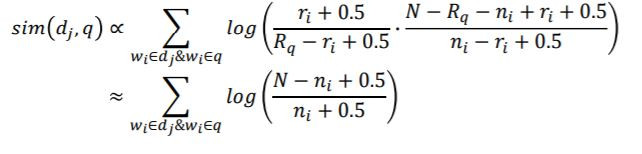
機率模式 (Probabilistic Model) 為1976年由Roberston和Sparck Jones所提出的,它以機率的架構來解資訊檢索問題,嘗試計算文章和使用者問題的相關性機率值表示為:
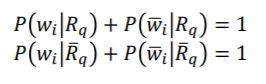
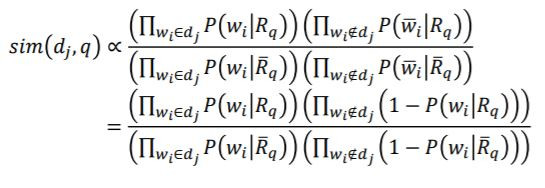
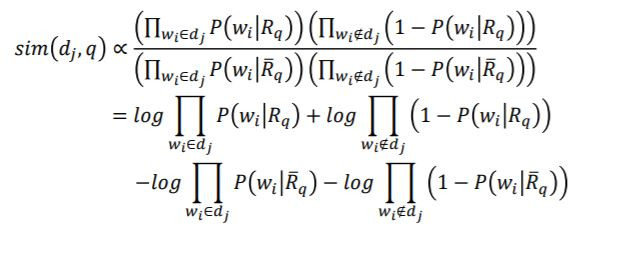
  • P(https://chart.googleapis.com/chart?cht=tx&chl=%24R_q%24|https://chart.googleapis.com/chart?cht=tx&chl=%24d_j%24)
    此機率值要越大越好,以下為一連串推導/images/emoticon/emoticon08.gif

假設

  • https://chart.googleapis.com/chart?cht=tx&chl=%24R_q%24為當給定query q時,一群相關的文章
  • https://chart.googleapis.com/chart?cht=tx&chl=%24%24%5Cvec%7B%24R_q%24%7D%20%24%24為當給定query q時,一群不相關的文章
  • P(https://chart.googleapis.com/chart?cht=tx&chl=%24R_q%24|https://chart.googleapis.com/chart?cht=tx&chl=%24d_j%24)為當給定文章https://chart.googleapis.com/chart?cht=tx&chl=%24d_j%24為相關query q的機率值
  • P(https://chart.googleapis.com/chart?cht=tx&chl=%24%24%5Cvec%7B%24R_q%24%7D%20%24%24|https://chart.googleapis.com/chart?cht=tx&chl=%24d_j%24)為當給定文章https://chart.googleapis.com/chart?cht=tx&chl=%24d_j%24為不相關query q的機率值
    則可以定義relevance degree,來計算 "查詢" 與 "文件" 的相似度, 越相似代表越相關 :
    sim(https://chart.googleapis.com/chart?cht=tx&chl=%24d_j%24,q)=P(https://chart.googleapis.com/chart?cht=tx&chl=%24R_q%24|https://chart.googleapis.com/chart?cht=tx&chl=%24d_j%24)/P(https://chart.googleapis.com/chart?cht=tx&chl=%24%24%5Cvec%7B%24R_q%24%7D%20%24%24|https://chart.googleapis.com/chart?cht=tx&chl=%24d_j%24)
    上述公式透過貝氏定理(Bayes' rule):
    https://ithelp.ithome.com.tw/upload/images/20200902/20110042Qg66mQBmHH.jpg
    由於一篇文章由多個word所組成的,因此:
    https://ithelp.ithome.com.tw/upload/images/20200902/20110042eKy48BZA0x.jpg
    因為我們假設index terms遵守Bernoulli distributions:
    https://ithelp.ithome.com.tw/upload/images/20200902/20110042PDrb8pYC50.jpg
    所以機率模型可以改寫如下:
    https://ithelp.ithome.com.tw/upload/images/20200902/20110042hJtibgmvYf.jpg
    如果同取log的話,乘->加,除->減
    https://ithelp.ithome.com.tw/upload/images/20200902/20110042DSoNbFcCfH.jpg
    加上一些計算上的技巧(多加藍色區塊)
    https://ithelp.ithome.com.tw/upload/images/20200902/201100426rT4PaGPct.jpg
    改消去的消一消,最後可得
    https://ithelp.ithome.com.tw/upload/images/20200902/20110042ioWUIWUTB1.jpg
    現在我們列一個表,其中N表示所有文章數;ni表示ni篇文章含有wi,N-ni篇文章不含有wi;Rq篇文章是相關文章,N-Rq篇文章是不相關文章
    https://ithelp.ithome.com.tw/upload/images/20200902/20110042ryxeTC5CET.png
    透過這個表格,機率式表示為:
    https://ithelp.ithome.com.tw/upload/images/20200902/20110042uOckmOfq3W.jpg
    代入sim(dj,q)中,可得到:
    https://ithelp.ithome.com.tw/upload/images/20200902/201100422gvXnBbzou.jpg
    為了避免分子分母為零,所以加上0.5
    https://ithelp.ithome.com.tw/upload/images/20200902/20110042a0u35Q0EuL.jpg
    但是在真實情況下我們不會知道Rq和ri,那就設定為零
    https://ithelp.ithome.com.tw/upload/images/20200902/20110042cUlSMxYLyB.jpg

分析

  • 優點:
  1. 透過此方法可以排序了
  • 缺點:
  1. 沒有考慮到頻率這項要素
  2. 沒有考慮到文章長度正規化,越長的文章就會分數高

上一篇
Day02:布林模型(Boolean Model)
下一篇
Day04:TF-IDF演算法
系列文
資訊爆炸時代學資訊檢索與擷取8
圖片
  直播研討會
圖片
{{ item.channelVendor }} {{ item.webinarstarted }} |
{{ formatDate(item.duration) }}
直播中

尚未有邦友留言

立即登入留言