昨天我們完成了全台即時水位與水位站基本資料介接的功能,從圖面上可以一目了然看出哪些地方的水位站有超過警戒值、哪些沒有,但由於圖面上沒有顯示測站的名稱 (若有顯示也會造成整個圖面混雜),所以目前只能達到以文查圖、而不能以圖查文。
為了讓使用者也能點選地圖的Symbol也可以得到測站相關資訊,開發Popup功能應該是最為整潔與直覺的方式 (畢竟以前開發有些人跟我說過,為什麼我們的圖台不能像google map一樣直接點選icon顯示詳細資料? 阿有些架構就是不能阿,原本就有)identify功能要有所取捨,跟你解釋了又不聽,兩個都要阿不然你自己來開發阿
Popup顯示的界面本次採用Bootstrap的tooltip樣式,根據 Bootstrap的技術文章 上說明:
Tooltips rely on the 3rd party library
Popper.jsfor positioning. You must includepopper.min.jsbefore bootstrap.js or usebootstrap.bundle.min.js/bootstrap.bundle.jswhich containsPopper.jsin order for tooltips to work!
jQuery之前我們已經載入過了,現在要連帶 popper.js 一起載入,前後順序也要注意。
<link type="text/css" href="css/Plug_in/bootstrap.min.css" rel="stylesheet" />
<script type="text/javascript" src="js/Plug_in/jquery-3.5.1.js"></script>
<script type="text/javascript" src="js/Plug_in/popper.min.js"></script>
<script type="text/javascript" src="js/Plug_in/bootstrap.min.js"></script>
首先,先在主頁面 map.aspx 內新增一個popup用的div
<div id="popup"></div>
接著於 js/init.js 建立popup,並透過 .on 綁定 click 事件,點選圖面得到pixel坐標、callback回傳pixel選到的feature,將popup的位置設在feature上,並設定popup的參數和函式 popover 顯示。
// 建立popup
var popup = new ol.Overlay({
        element: document.getElementById('popup')
    });
map.addOverlay(popup);

// display popup on click
map.on('click', function (evt) {
    var element = popup.getElement();
    $(element).popover('dispose');
    var feature = map.forEachFeatureAtPixel(evt.pixel,
            function (feature) {
            return feature;
        });
    // 若只抓水位資料圖層顯示popup
    // if (Object.values(map.e_getLayer("weterlevelLyr").getSource().getFeatures()).indexOf(feature) >= 0) {
    if (feature) {
        popup.setPosition(evt.coordinate);
        //加了container,popup才會跟著地圖走
        $(element).popover({
            container: element,
            placement: 'top',
            animation: false,
            html: true,
            content: feature.info
        });
        $(element).popover('show');
    } else {
        $(element).popover('dispose');
    }
});
設定當滑鼠游標指到 feature 上,游標改為點選的圖示。
// change mouse cursor when over marker
map.on('pointermove', function (e) {
    var element = popup.getElement();
    if (e.dragging) {
        $(element).popover('dispose');
        return;
    }
    var pixel = map.getEventPixel(e.originalEvent);
    var hit = map.hasFeatureAtPixel(pixel);
    map.getViewport().style.cursor = hit ? 'pointer' : '';
});
設定feature的info,popup會依照info顯示資訊。
var pointfeature = helper.transOlGeometry_4326to3857(new ol.Feature({
            geometry: new ol.geom.Point([obj[i].Longitude, obj[i].Latitude])
        }));
pointfeature.info = '測站:' + obj[i].StationName + "</br>目前水位高度:" + obj[i].WaterLevel + " m";
最後,依據資料的長度設定 Popup info 框的寬度。
.popover-body {
    width: 160px;
}
Popup頁面示意圖:
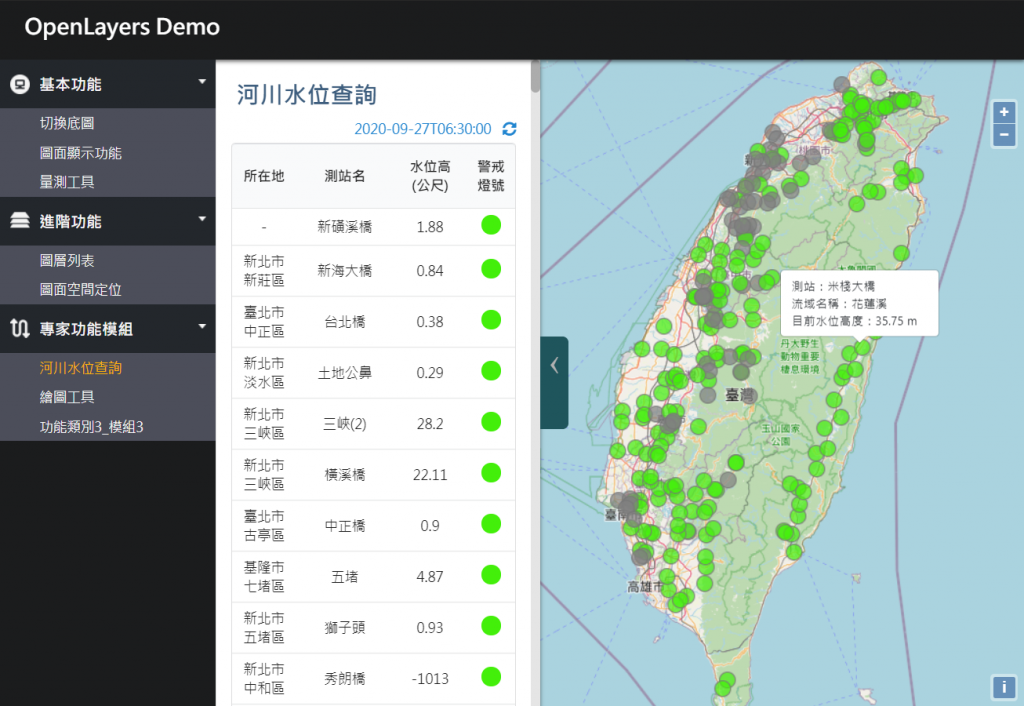
今天學會如何顯示Popup的資訊,達到 以文查圖 和 以圖查文 雙向查詢的目標。
整個系列經過這麼多天不同介接方式的練習,大家應該對於介接資料非常的熟悉了吧!明天又是讓大家腦袋休息放鬆的 不寫程式改來學知識 系列,讓我們來看一下現在 有哪些好用的圖台 可以提供大家開發時的參考。