今天來進行河川水位站的介接,回歸寫程式囉~
水位站資料:
水位警戒值資料:
河川水位的資料可由上述兩者API進行介接,民生公共物聯網的API遵循 OGC SensorThings API 標準,架構較為複雜一點,使用者需要花一些時間了解,而WRA API則是屬於 oData 服務的api,可以利用$filter來進行特定資料的過濾(ex.只撈出花蓮縣的水位站資料)。
由於本功能希望藉由水位即時資料與水位警戒資料進行判斷是否達到警戒值,若達到不同等級的警戒值,其燈號顯示應與水利署的規範一致,並同時展示在地圖上方便一眼看出哪個地方到達水位警戒,因此除了即時測站水位外,也需要警戒值的資料。
由於WRA API已有提供警戒值的資訊可以介接,且形式較為簡單 (不然又要花整篇的時間解釋OGC SensorThings API 標準了),本次就直接接這支api進行功能的開發囉~
若大家有興趣可以改民生公共物聯網的API試試看
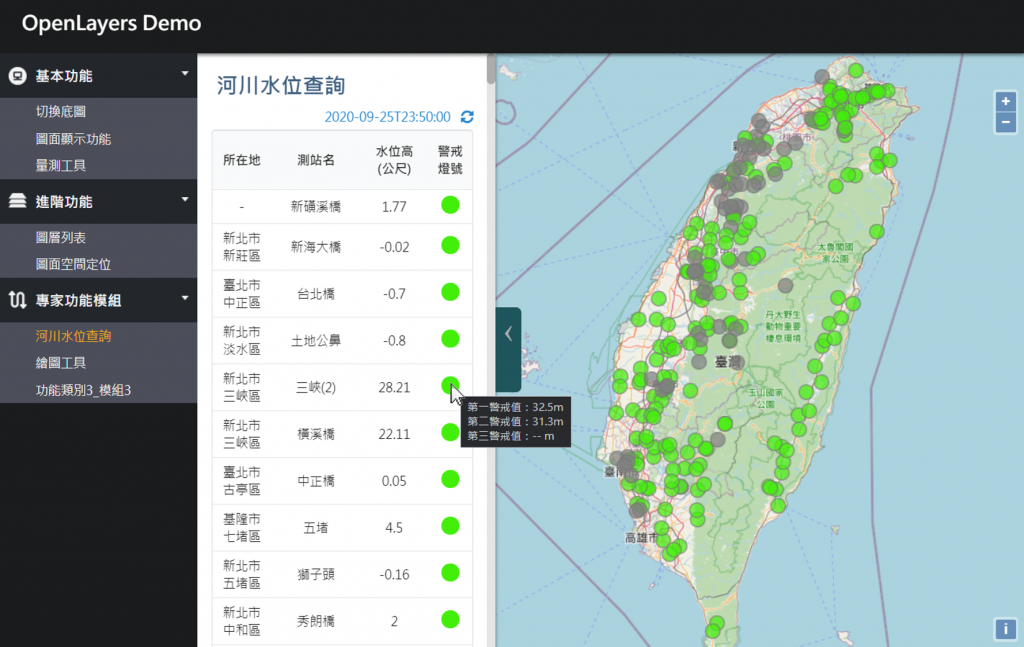
建立ExpertModule/WaterLevel.html頁面,預計要顯示所有水位站的列表,包含所在地、測站名、即時水位高(公尺)、警戒燈號等資訊。
預計規劃要顯示撈取資料的時間和重新整理 (執行waterlevel.getWeterLevelData()) 按鈕。
<!DOCTYPE html>
<html>
<head>
    <meta charset="utf-8" />
    <title></title>
    <style>
        div.circle {
            width: 20px;
            height: 20px;
            border-radius:999em;
            display: inline-block;
            cursor: pointer;
        }
            div.circle.normal {
                background-color: #43ef0a;
            }

            div.circle.WarningLevel3 {
                background-color: yellow;
            }

            div.circle.WarningLevel2 {
                background-color: orange;
            }

            div.circle.WarningLevel1 {
                background-color: red;
            }

            div.circle.unknown {
                background-color: gray;
            }
    </style>
</head>
<body>
    <h2>河川水位查詢</h2>
    <!-- 重新整理按鈕 -->
    <div style="float:right; padding:0px 10px 5px 10px; cursor:pointer;" id="waterlevelLoadingInfo" onclick="waterlevel.getWeterLevelData()"><i class="sync alternate blue icon"></i></div>
    <!-- 資料時間 -->
    <div style="float:right; padding:0px 0px 5px 0px; color:#2486d0;" id="waterlevelTime"></div>
    <div>
        <table class="ui compact center aligned table">
            <thead>
                <tr>
                    <th style="width:65px;">所在地</th>
                    <th>測站名</th>
                    <th>水位高(公尺)</th>
                    <th style="width:50px;">警戒燈號</th>
                </tr>
            </thead>
            <tbody id="waterlaveltable">
            </tbody>
        </table>
    </div>
    <script type="text/javascript" src="map_module/widget/ExpertModule/jWaterLevel.js"></script>
    <script>
        waterlevel.getWeterLevelData();
    </script>
</body>
</html>
建立ExpertModule/jWaterLevel.js頁面
var waterlevel = function () {
    var stationObj;
    var RealTimeInfoObj;

    return {
        getWeterLevelData:getWeterLevelData,
        checkLayerValid:checkLayerValid,
        showData:showData,
        locateWaterStation:locateWaterStation
    };
}();
首先依慣例,先建一個專屬於水位站資料的layer,id為waterlevelLyr,應每次在撈取資料時檢查這個Layer是否存在checkLayerValid():
function checkLayerValid() {
    if (map.e_getLayer("weterlevelLyr") === undefined) {
        weterlevelLyr = new ol.layer.Vector({
            source: new ol.source.Vector({})
        });
        weterlevelLyr.id = "weterlevelLyr";
        map.addLayer(weterlevelLyr);
    } else {
        weterlevelLyr = map.e_getLayer("weterlevelLyr");
        weterlevelLyr.getSource().clear();
    }
}
接入水位站資料,但由於水位即時資料只有站點的ID StationNo,而沒有測站的資料,水位基本資料(警戒值)的api有提供測站基本資料,因此在最後組出頁面之前必須這兩個成果都要得到。
這部分可以寫call back去執行,也可以直接寫兩個ajax串起來,只是這樣就會有前後載入的等待時間。
以StationNo為key,將兩組資料串起來,但兩組資料的筆數不會相同,所以有以下判斷邏輯:
判斷完後直接將基本資料和警戒值資料併入即時資料內,最後呼叫showData()。
function getWeterLevelData() {
    $("#waterlevelLoadingInfo i").addClass("loading");
    $("#waterlaveltable").html("");
    $("#waterlevelTime").html("");
    waterlevel.checkLayerValid();
    // 水位站警戒值
    $.ajax({
        type: "GET",
        url: "https://fhy.wra.gov.tw/WraApi/v1/Water/Station?$orderby=Address",
        dataType: "json",
        contentType: "application/json; charset=utf-8",
        success: function (d) {
            stationObj = d;
            // 即時水位資料
            $.ajax({
                type: "GET",
                url: "https://fhy.wra.gov.tw/WraApi/v1/Water/RealTimeInfo?$orderby=StationNo",
                dataType: "json",
                contentType: "application/json; charset=utf-8",
                success: function (d) {
                    RealTimeInfoObj = d;
                    RealTimeInfoObj.forEach(function (item, index) {
                        var spobj = stationObj.filter(k => k.StationNo === item.StationNo);
                        if (spobj.length > 0) {
                            var keyarr = Object.keys(spobj[0]);
                            for (let i = 0; i < keyarr.length; i++) {
                                RealTimeInfoObj[index][keyarr[i]] = spobj[0][keyarr[i]];
                            }
                        }
                    });
                    waterlevel.showData(RealTimeInfoObj, 'waterlaveltable');
                },
                error: function (jqXHR, exception) {
                    ajaxError(jqXHR, exception);
                }
            });
        },
        error: function (jqXHR, exception) {
            ajaxError(jqXHR, exception);
        }
    });
}
撰寫showData()進行資料的展示,依據水利署規範進行燈號的顯示,規範如下:
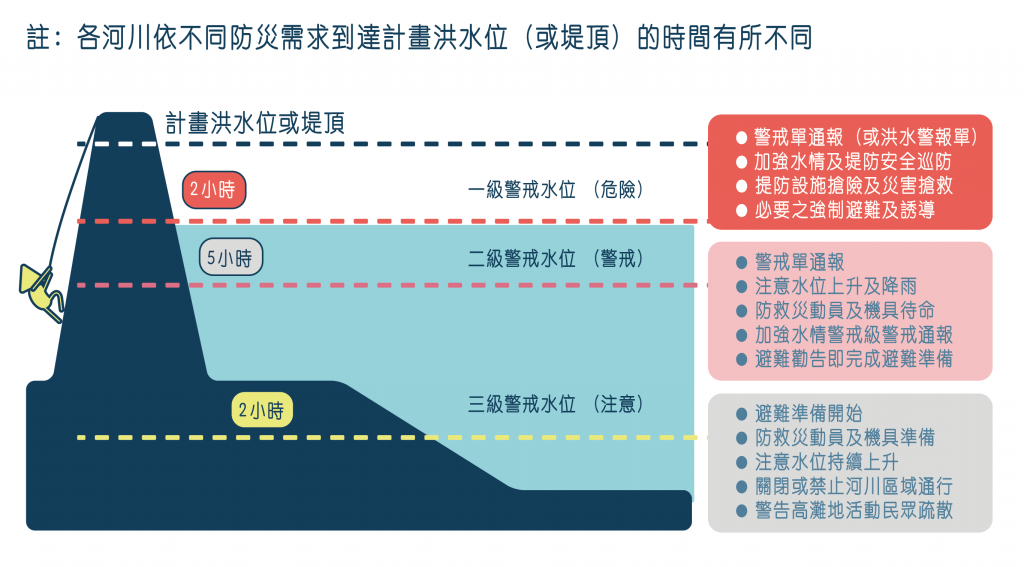
未達警戒水位:地圖以綠色表示。三級警戒水位:河川水位預計未來2小時到達高灘地之水位。(地圖以黃色表示三級)。二級警戒水位:河川水位預計未來5小時到達計畫洪水位(或堤頂)時之水位。(地圖以橘色表示二級)。一級警戒水位:河川水位預計未來2小時到達計畫洪水位(或堤頂)時之水位。(地圖以紅色表示一級)。因撈取的資料的坐標系統為4326,可參考 Day 13 進行坐標系統的轉換,將坐標轉至圖台底圖使用之3857坐標,並於地圖上展示水位站位置。
規劃當顯示燈號時,該燈號圖示有三種功用:
weterlevelhtml)。lighttitle)。locateWaterStation())。function showData(obj, domid) {
$("#" + domid).html("");
waterlevel.checkLayerValid();
var levelalertlight = '';
for (let i = 0; i < obj.length; i++) {
if (obj[i].Latitude !== undefined) {
var pointfeature = helper.transOlGeometry_4326to3857(new ol.Feature({
geometry: new ol.geom.Point([obj[i].Longitude, obj[i].Latitude])
}));
pointfeature.info = '測站:' + obj[i].StationName + "</br>流域名稱:" + obj[i].BasinName + "</br>目前水位高度:" + obj[i].WaterLevel + " m";
var fill;
if (obj[i].WaterLevel !== undefined && !(obj[i].WarningLevel1 === undefined && obj[i].WarningLevel2 === undefined && obj[i].WarningLevel3 === undefined)) {
if (obj[i].WarningLevel1 !== undefined && obj[i].WaterLevel > obj[i].WarningLevel1) {
levelalertlight = '<div class="circle WarningLevel1"></div>';
fill = new ol.style.Fill({
color: 'rgba(255,0,0,0.7)'
});
} else if (obj[i].WarningLevel2 !== undefined && obj[i].WaterLevel > obj[i].WarningLevel2) {
levelalertlight = '<div class="circle WarningLevel2"></div>';
fill = new ol.style.Fill({
color: 'rgba(255,165,0,0.7)'
});
} else if (obj[i].WarningLevel3 !== undefined && obj[i].WaterLevel > obj[i].WarningLevel3) {
levelalertlight = '<div class="circle WarningLevel3"></div>';
fill = new ol.style.Fill({
color: 'rgba(255,255,0,0.7)'
});
} else {
levelalertlight = '<div class="circle normal"></div>';
fill = new ol.style.Fill({
color: 'rgba(67,239,10,0.7)'
});
}
} else {
levelalertlight = '<div class="circle unknown"></div>';
fill = new ol.style.Fill({
color: 'rgba(128,128,128,0.7)'
});
}
var stroke = new ol.style.Stroke({
color: '#767676',
width: 1
});
pointfeature.setStyle(new ol.style.Style({
image: new ol.style.Circle({
fill: fill,
stroke: stroke,
radius: 8
}),
fill: fill,
stroke: stroke
}));
weterlevelLyr.getSource().addFeature(pointfeature);
var x3857 = pointfeature.getGeometry().getCoordinates()[0];
var y3857 = pointfeature.getGeometry().getCoordinates()[1];
// 燈號mouseover顯示警戒值備註
var lighttitle = '第一警戒值:' + (obj[i].WarningLevel1 === undefined ? '-- ' : obj[i].WarningLevel1) + 'm\n第二警戒值:' + (obj[i].WarningLevel2 === undefined ? '-- ' : obj[i].WarningLevel2) + 'm\n第三警戒值:' + (obj[i].WarningLevel3 === undefined ? '-- ' : obj[i].WarningLevel3) + 'm';
// 水位測站列表
var weterlevelhtml = '<tr><td class="middle aligned">' + (obj[i].Address === undefined ? '-' : obj[i].Address.substring(0, 6)) + '</td><td class="middle aligned">' + (obj[i].StationName === undefined ? '-' : obj[i].StationName) + '</td><td class="middle aligned">' + (obj[i].WaterLevel === undefined ? '-' : obj[i].WaterLevel) + '</td><td class="middle aligned" title="' + lighttitle + '" onclick="waterlevel.locateWaterStation(\'' + x3857 + '\',\'' + y3857 + '\')">' + levelalertlight + '</td></tr>';
$("#" + domid).append(weterlevelhtml);
}
}
$("#waterlevelTime").html(obj[0].Time);
$("#waterlevelLoadingInfo i").removeClass("loading");
}
點選燈號執行 locateWaterStation(),定位到該點。
function locateWaterStation(x, y) {
    map.e_centerAndZoom(new ol.Feature({
            geometry: new ol.geom.Point([x, y])
        }), 5);
}
今天完成了即時水位站的介接、測站基本資料與警戒值的介接,撰寫更新資料的button等功能。
此功能主要是要了解如何介接、串資料、展示資料、建立資料更新機制,完整走過一整個介接流程,但圖面上只有顯示燈號無法得知該點是哪個測站,因此明天就要來寫popup info功能,點選圖面上的圖徵,即可顯示該點相關資訊。