pipenv install pandas
pipenv install plotly
pipenv install kaleido
import plotly.express as px
import pandas as pd

df = pd.DataFrame([
    dict(Task = "工作1", Start = '2023-09-13', End = '2023-10-25', Assigned = "Rita", Difficulty = 70),
    dict(Task = "工作2", Start = '2023-12-03', End = '2024-02-14', Assigned = "Rita", Difficulty = 20),
    dict(Task = "工作3", Start = '2023-10-20', End = '2024-03-17', Assigned = "奴隸 A", Difficulty = 30),
    dict(Task = "工作4", Start = '2023-02-21', End = '2024-07-06', Assigned = "奴隸 B", Difficulty = 50),
    dict(Task = "工作5", Start = '2024-01-01', End = '2024-09-28', Assigned = "奴隸 C", Difficulty = 80)
])

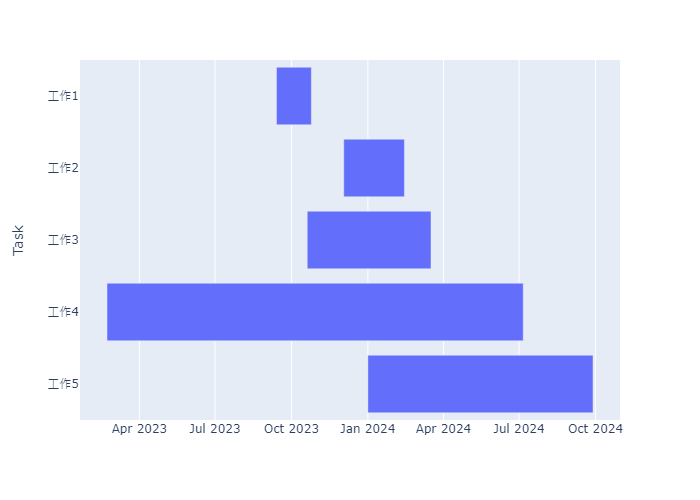
fig = px.timeline(df, x_start = "Start", x_end = "End", y = "Task")
# Tasks from top to bottom
fig.update_yaxes(autorange = "reversed")
# fig.show()
fig.write_image("甘特圖.png")

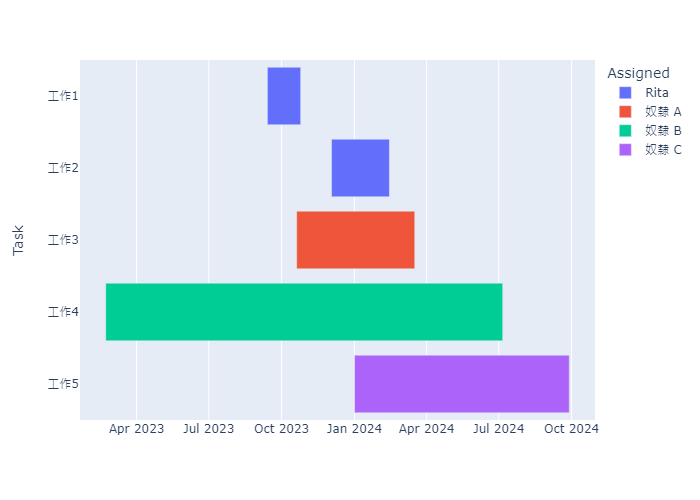
fig = px.timeline(df, x_start = "Start", x_end = "End", y = "Task", color = "Assigned")

