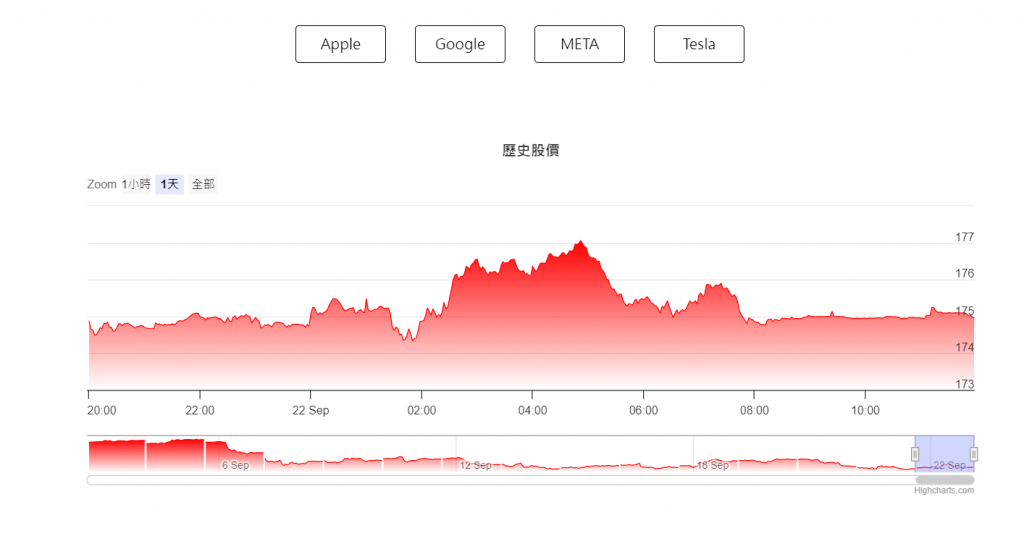
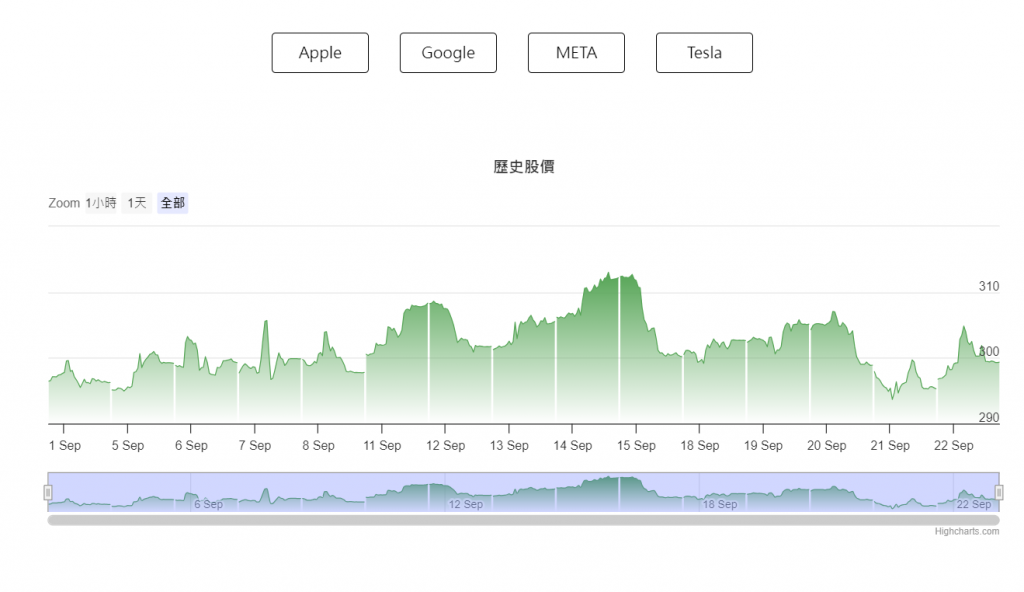
延續昨天的走勢圖
今天主要任務是把圖表的細節完善
更換股票
以及根據股價漲跌顯示綠色(漲)或紅色(跌)
(美國漲跌幅顏色跟國內相反)
<template>
  <div class="box">
    <button
      class="btn-primary"
      @click="getData('AAPL')"
    >
      Apple
    </button>
    <button
      class="btn-primary"
      @click="getData('GOOGL')"
    >
      Google
    </button>
    <button
      class="btn-primary"
      @click="getData('META')"
    >
      META
    </button>
    <button
      class="btn-primary"
      @click="getData('TSLA')"
    >
      Tesla
    </button>
  </div>
  <ClientOnly>
    <highcharts v-if="realTimeOffer" class="w-[1000px] mx-auto my-10" :constructor-type="'stockChart'"   :options="chartOptions"  />
  </ClientOnly>
</template>
<script setup>
import charts from "highcharts";

const axios = inject('axios')

// 股票資料
const data = ref()

const getData = (stock='AAPL') => {
  axios
    .get(`https://www.alphavantage.co/query?function=TIME_SERIES_INTRADAY&symbol=${stock}&interval=1min&outputsize=full&apikey=秘密`)
    .then((res) => {
      data.value=Object.entries(res.data['Time Series (1min)']).map(([date, values]) => ({ date, ...values }));
    })
    .catch((err) => {
      console.log(err)
    })
}

onMounted(()=>{
  getData()
})

// 將資料轉換成[時間,股價]
const realTimeOffer = computed(()=>{
  return data.value?data.value.reverse().map((v,i)=>{
    const dateTimeString = v.date; // 日期
    let milliseconds // 換算後的時間
    const dateObject = new Date(dateTimeString);
      milliseconds = dateObject.getTime();
    return [milliseconds,parseFloat(v['2. high'])]
  }) : undefined
})

// 漲跌幅顏色
const colorsOfUpsAndDowns = computed(()=>{
  return realTimeOffer.value[0][1]>realTimeOffer.value[realTimeOffer.value.length-1][1]
})

const chartOptions = computed(()=>{
  return{
        title: {
          text: '歷史股價'
        },
        xAxis: {
            gapGridLineWidth: 0
        },
        yAxis: {
          // floor: 4300,
          // ceiling: 4500
        },
        rangeSelector: {
            buttons: [{
                type: 'hour',
                count: 1,
                text: '1小時'
            }, {
                type: 'day',
                count: 1,
                text: '1天'
            }, {
                type: 'all',
                count: 1,
                text: '全部'
            }],
            selected: 1,
            inputEnabled: false
        },

        series: [{
            name: 'test',
            type: 'area',
            data: realTimeOffer.value,
            color:colorsOfUpsAndDowns.value?'#ff0000':'#56a556',
            gapSize: 5,
            tooltip: {
                valueDecimals: 2
            },
            showInLegend:true,
            fillColor: {
                linearGradient: {
                    x1: 0,
                    y1: 0,
                    x2: 0,
                    y2: 1
                },
                stops: [
                    [0, colorsOfUpsAndDowns.value?'#ff0000':'#56a556'],
                    [1, charts.color(colorsOfUpsAndDowns.value?'#ff0000':'#56a556').setOpacity(0).get('rgba')]
                ]
            },
            threshold: null
        }]
      }})

</script>
1.將Y軸上下限改為根據呈現資料來決定
        // 原本
        yAxis: {
          floor: 4300,
          ceiling: 4500
        },
        // 改為
        threshold: null
2.增加漸層色
fillColor: {
    linearGradient: {
        x1: 0,
        y1: 0,
        x2: 0,
        y2: 1
    },
    stops: [
        [0, colorsOfUpsAndDowns.value?'#ff0000':'#56a556'],
        [1, charts.color(colorsOfUpsAndDowns.value?'#ff0000':'#56a556').setOpacity(0).get('rgba')]
    ]
},
3.處理回傳資料成適合格式axios裡取得的物件
先把物件的值轉成陣列(股價)
再把原物件的key值(日期)塞進去陣列
4.新增股票選擇按鈕,並根據漲跌幅決定顏色
在getData新增參數stock,用以更換api裡查詢股票的參數
然後用陣列的第一筆跟最後一筆決定是漲是跌
去決定顏色
const colorsOfUpsAndDowns = computed(()=>{
  return realTimeOffer.value[0][1]>realTimeOffer.value[realTimeOffer.value.length-1][1]
})


小結:
今天被耽誤比較久的還是資料處理
換了一隻api
格式差了不少
矩陣都不矩陣
物件都不物件啦!!
接下來應該會越來越深入圖表本身的事件
及影響圖的部分
