
| 資訊處理流程 | 生成 | 收集 | 儲存 | 使用 |
|---|---|---|---|---|
| OpenTelemetry SDK | ✓ |
在 OpenTelemetry 的官網上,上面介紹著 「OpenTelemetry is a collection of APIs, SDKs, and tools.」,本篇將簡單介紹如何透過 OpenTelemetry 的 SDK 來生成 Telemetry Data。
OpenTelemetry 支援多種程式語言的 SDK,使開發者能迅速將其整合至現有系統,並將資料傳送至不同的 Tracing System 作為儲存 Trace 資訊的 Tracing Backend。使用 OpenTelemetry SDK 是一種基本的整合方式,需要開發者在程式碼中手動添加 Trace 資訊和其他相關細節,但這種方式需要開發者對 OpenTelemetry 的 API 有一定的了解。
為了讓開發者能再更輕鬆整合 OpenTelemetry,OpenTelemetry 提供了 Instrumentation。Instrumentation一般翻譯為「儀器化」。在軟體工程領域,這是一種用來測量服務效能、行為以及其他相關資訊的機制。OpenTelemetry 提供的 Instrumentation 分為兩種:
由於 Automatic Instrumentation 功能強大且簡單易用,本篇會重點介紹這方面的使用方式。
使用 Automatic Instrumentation 時,簡單的資料流向如下:
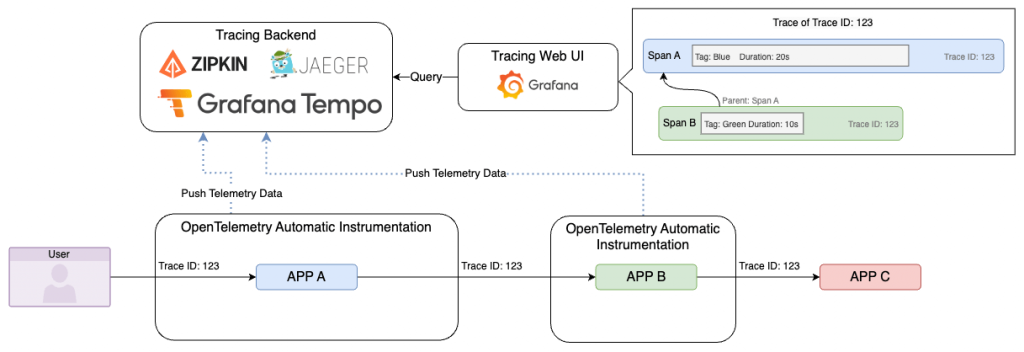
APP A 與 APP B 配有 Automatic Instrumentation,以 Filter 或 Middleware 的方式罩住 Application,會自動判斷接收到的 Request 有沒有 Trace ID,若有就沿用,沒有就生成新的Trace ID。
Automatic Instrumentation 的設定方式因不同語言和框架而有所不同,但通常透過環境變數或設定檔來完成。以環境變數為例,以下是一些常用的參數:
OTEL_TRACES_EXPORTER:設定 Trace 資料傳送的方式,例如 otlp、jaeger。
OTEL_EXPORTER_OTLP_ENDPOINT:使用 OTLP 時,搭配的 Endpoint 參數,例如 http://localhost:4317。OTEL_EXPORTER_JAEGER_ENDPOINT:使用 Jaeger 時,搭配的 Endpoint 參數,例如 http://localhost:14250。service-a,有兩種方式可以設定:
OTEL_SERVICE_NAME:設定服務名稱,例如 service-a。OTEL_RESOURCE_ATTRIBUTES:透過增加資源屬性來設定 service.name,例如 service.name=service-a。OTEL_PROPAGATORS:設定用以傳遞 Tracing Header 的方式,可設置多個,用 , 分隔,預設為 tracecontext,baggage。通常用於跟其他 Tracing System 整合時使用,例如 OTEL_PROPAGATORS=tracecontext,baggage,jaeger,詳細資訊可參考 Propagators。目前,最完整的環境參數設定說明是 Java 的 OpenTelemetry SDK Autoconfigure 文件。由於這些設定方式通常是跨語言的,因此也可以參考 Java 的設定來應用在其他語言。
在多執行緒的應用程式中,不同執行緒所產生的 Log 可能會交錯,使得難以追蹤問題。透過 OpenTelemetry 的 SDK 和 Log Pattern 的調整,我們可以將 Trace ID 加入到日誌中。這樣一來,問題排除就能從 Trace 開始,接著根據 Log 中的 Trace ID 定位具體的問題點。
範例 Log 如下:
[2021-10-13 10:00:00,000] [INFO] [trace_id=123] [class=Main] [message=Hello World]
[2021-10-13 10:00:01,000] [INFO] [trace_id=456] [class=Worker] [message=Hello World]
[2021-10-13 10:00:02,000] [INFO] [trace_id=456] [class=Worker] [message=Hello World]
[2021-10-13 10:00:03,000] [INFO] [trace_id=123] [class=Worker] [message=Hello World]
不同程式語言有其特定的 Log 搭配機制。例如,Python 使用 OpenTelemetry Logging Instrumentation,而 Java 則是配合 Log4j 和 Logback 使用 Logger MDC auto-instrumentation 和 MDC 機制。
在 Python 環境下,使用 Automatic Instrumentation 至少需要安裝以下三個主要套件:
opentelemetry-bootstrap -a install 時會偵測環境已安裝的其他套件,並自動安裝對應的 Instrumentation Library套件都安裝完畢後,啟動 Automatic Instrumentation 的方式為使用 opentelemetry-instrument 指令帶起 Python 的程式,例如:
opentelemetry-instrument python main.py
共有兩種方式可以設定 OpenTelemetry Instrumentation 的參數:
以設定 OTLP Endpoint 為 http://localhost:4317 的情境為例:
# 使用 Environment Variables
OTEL_EXPORTER_OTLP_ENDPOINT=http://localhost:4317 opentelemetry-instrument python main.py

# 使用 CLI arguments
opentelemetry-instrument --exporter_otlp_endpoint http://localhost:4317 python main.py
目前針對 Python 的文件沒有提供完整的參數清單,但可以透過 opentelemetry-instrument --help 指令來查看。
Java 的 Automatic Instrumentation 只支援 Java 8 以上的版本與特定的工具,支援的 Library、Framework、Application Server 與 JVM 可以參考 官方文件。使用 Automatic Instrumentation 後,會自動捕捉進出該服務的所有 Request,並產生相對應的 Telemetry Data,包括了對服務的 Request、對外部服務發送的 Request、資料庫操作等。
啟動 Java 的 Automatic Instrumentation 只需要在執行時使用 -javaagent 參數指定 OpenTelemetry Instrumentation for Java 的 agent jar 檔:
java -javaagent:path/to/opentelemetry-javaagent.jar -jar myapp.jar
Agent jar 檔可以在 Repo 的 Releases Assets 下載,或者直接下載最新版。
共有四種方式可以設定 OpenTelemetry Agent 的參數,完整的參數清單可參考官方文件,優先順序由高到低:
以設定 OTLP Endpoint 為 http://localhost:4317 為例,三種常見的設定方式如下:
System Properties
java -javaagent:path/to/opentelemetry-javaagent.jar \
     -Dotel.exporter.otlp.endpoint=http://localhost:4317 \
     -jar myapp.jar
Environment Variables
OTEL_EXPORTER_OTLP_ENDPOINT=http://localhost:4317 java -javaagent:path/to/opentelemetry-javaagent.jar -jar myapp.jar
Configuration File
# path/to/otel.properties
otel.exporter.otlp.endpoint=http://localhost:4317
java -javaagent:path/to/opentelemetry-javaagent.jar \
     -Dotel.javaagent.configuration-file=path/to/otel.properties \
     -jar myapp.jar
範例程式碼:19-otel-sdk
啟動所有服務
docker-compose up -d
檢視服務
docker logs -f app-a 或 docker logs -f app-b 檢視 Log 中的 Trace IDdocker logs -f app-c 檢視 Log 中的 Trace IDadmin/admin
Tempo,即可看到 Tempo 收集的 Traces/chain 發送 Request,可以在 Trace 資訊中看到 app-a、app-b、app-c 互相呼叫的順序
關閉所有服務
docker-compose down
想要迅速掌握 OpenTelemetry,最有效的方法是透過一個 Demo Project 來直接體驗其功能。除了本篇 Lab 所介紹的 Python 和 Java 範例,OpenTelemetry 官方也推出了一個非常完整的 Demo Project,包含了 Docker 和 Kubernetes 兩個版本,可以直接使用。在學習了 Automatic Instrumentation 的基本使用方法後,也可以更進一步地自定義 OpenTelemetry 的使用。例如,可以利用 SDK 在 Span 中加入 Automatic Instrumentation 未提供的 Attribute,如 IP 或使用者資訊等。
您好,有兩個問題想要請教:
想請問 OpenTelemetry SDK 和 prometheus exporter 的功能是不是差不多呢?
我的情境是想要在希望能動越少 production 的 code,但看起來使用 OpenTelemetry 或是 exporter 都需要安裝在該台伺服器才能收集都資訊,也想詢問哪個方法比較推薦。
如果架設一台伺服器專門收集不同台的 server API 資訊,是否建議呢?會需要各 server 在 call api 的時候都打這一台 server 收集 API 資訊。
作者您好:
由於公司有多台 Server,且不同台 Server 語言環境也不盡相同。因此想在不動 legacy code 的情況下去增加監控系統。
我有嘗試您的 https://github.com/blueswen/observability-workshop-101/tree/main/lab-5
感覺大同小異,因此有點好奇 exporter 和 OpenTelemetry 在 API 層級應該都是提供差不多資訊。就我理解,exporter 是有系統資訊 + API,而 OpenTelemetry 是API + tracing。不知道這樣理解是否正確?
若有空再麻煩您回覆,謝謝!
opentelemetry-instrument,再串接 OpenTelemetry Collector 利用其 SpanMetrics 的功能計算出 Request 相關的 Metrics,Metircs 的採集由 Prometheus 去 OpenTelemetry Collector 的 Metircs Endpoint 爬取。詳細作法與說明可以參考我的另外一個 Project https://github.com/blueswen/opentelemetry-apm。非常感謝您的說明,後續我以您提供的方法2,架設 opentelemetry-instrument 並串接 OpenTelemetry Collector 來生成相關 Metrics。
不過仍有一個問題是,如果還是想要紀錄 CPU 和 Memory 等等資訊,應該是仍要透過 exporter。目前實作 OpenTelemetry 似乎沒有辦法記錄到系統相關資訊,僅能抓 API。
參考您提供的 連結,在實作上遇到一些小問題:
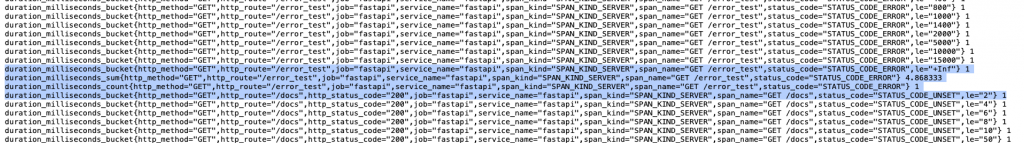
1.發現:
OpenTelemetry Collector 的 Metrics 不會紀錄 /error_test 所產生的 http_status_code,而是生成status_code="STATUS_CODE_ERROR"
並且此時 error 被紀錄是 span_kind="SPAN_KIND_SERVER" 而非不是 span_kind="SPAN_KIND_INTERNAL"

2. Grafana 儀表板:
因此在儀表板不會特別顯示 exception 500 的相關 error
(但如果是自己 raise HttpException 500 這個就會有)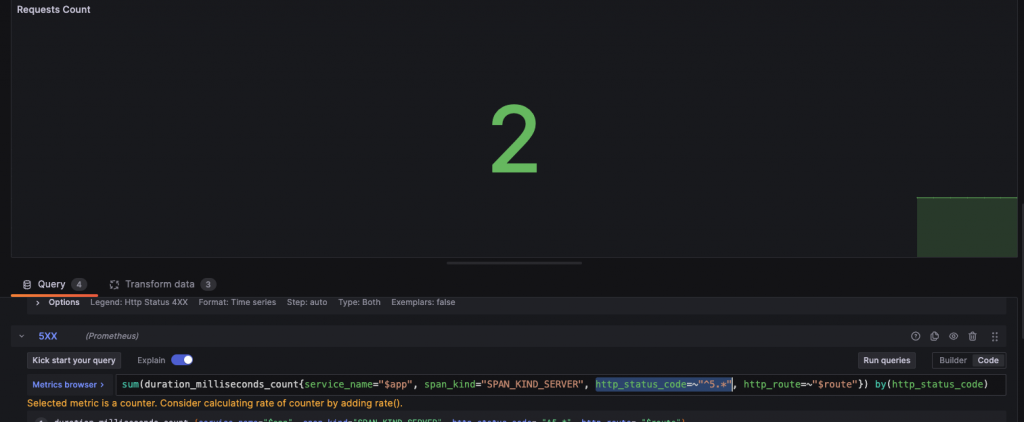
因此,如果想要將系統送出的 500 error 也抓住,讓 OTEL 生成 http_status_code=500,想請教這一塊有什麼建議作法嗎?
應該是因為 FastAPI 的 Automatic Instumentaion 本身設計的關係,當沒有以正常的流程回傳時,會無法捕捉到回傳的 Http Status Code,如下圖 Span 中的 Attribute: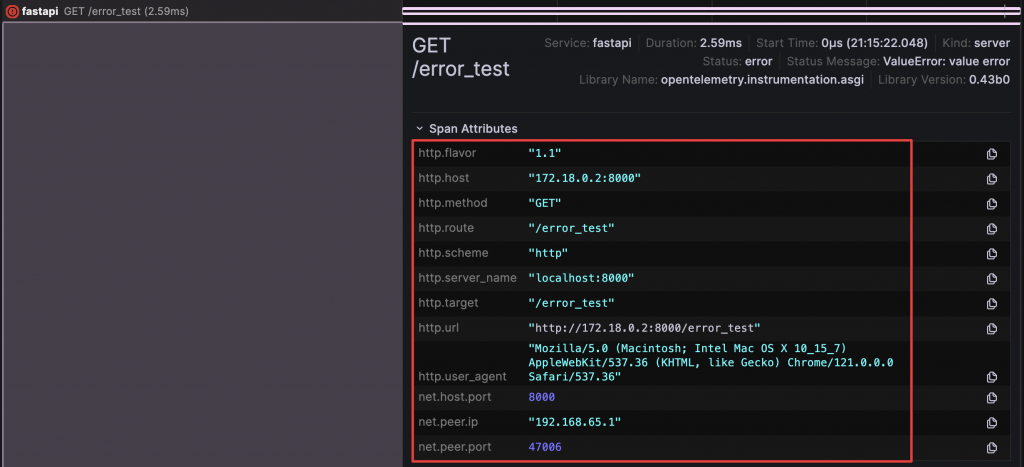
如果希望這類沒有辦法解析出 http_status_code 的 trace,也能有 http_status_code 的 label,可以參考 Span Metrics 的 文件,將 http_status_code 這個 dimension 加上 default 值,例如:
connectors:
  spanmetrics:
    dimensions:
      - name: http.method
      - name: http.status_code
        default: 500
      - name: http.route
