使用關聯式資料庫是目前最主流的儲存資料方式,Grafana 支援多種關聯式資料庫,例如開源的 PostgreSQL 和 MySQL。只需設定連線資訊並確保連線暢通後,便可輕鬆查詢資料。
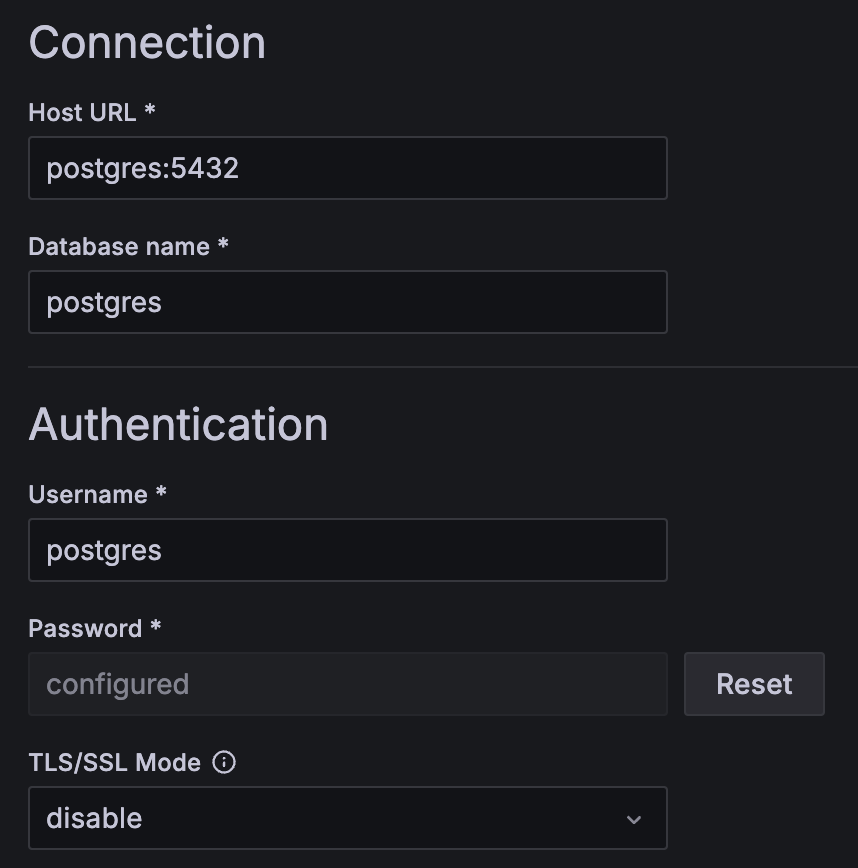
PostgreSQL 連線設定
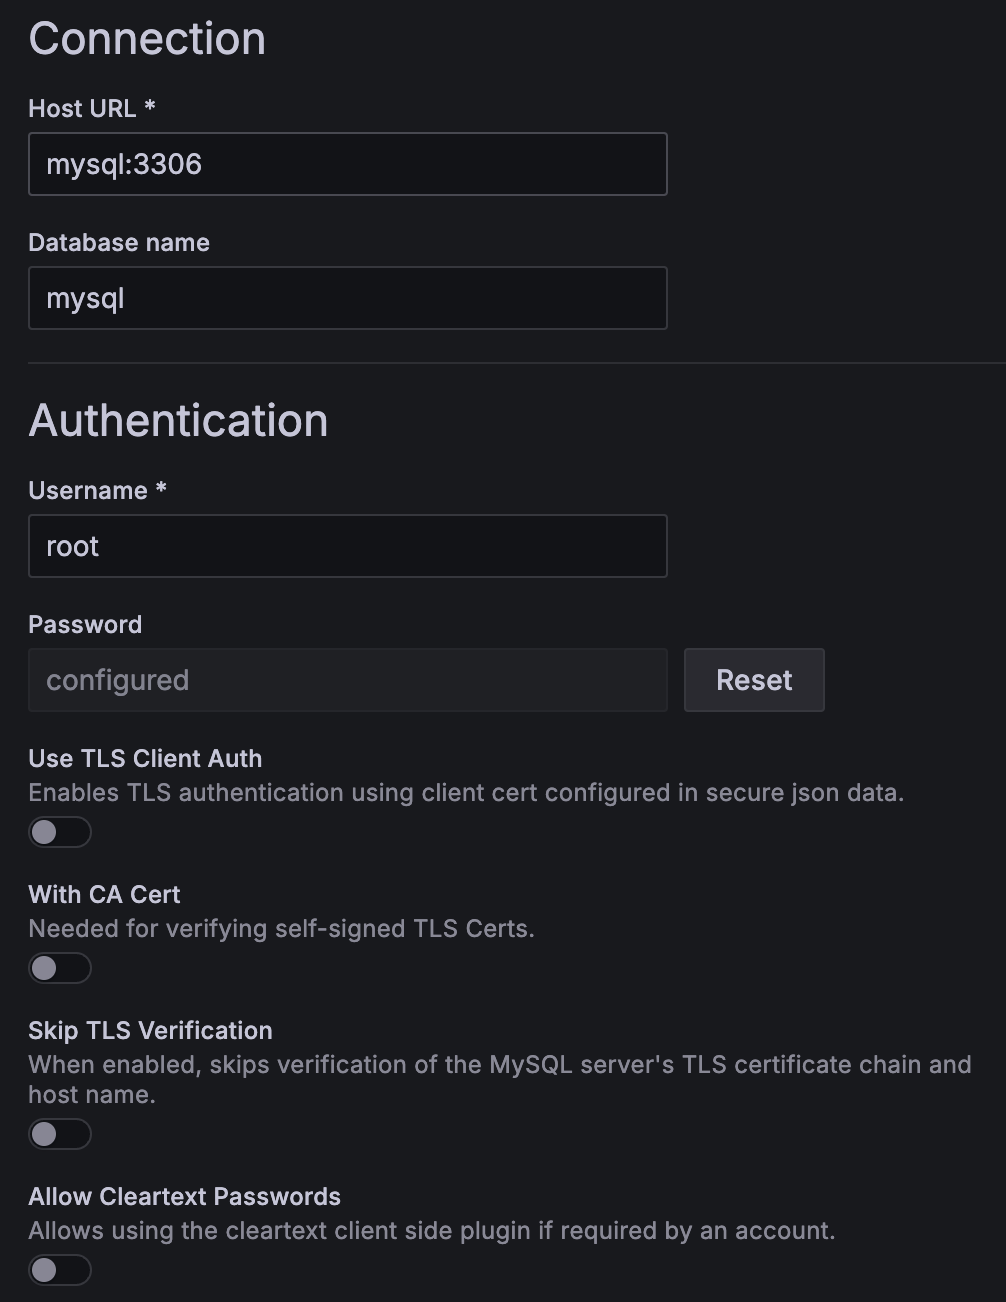
MySQL 連線設定
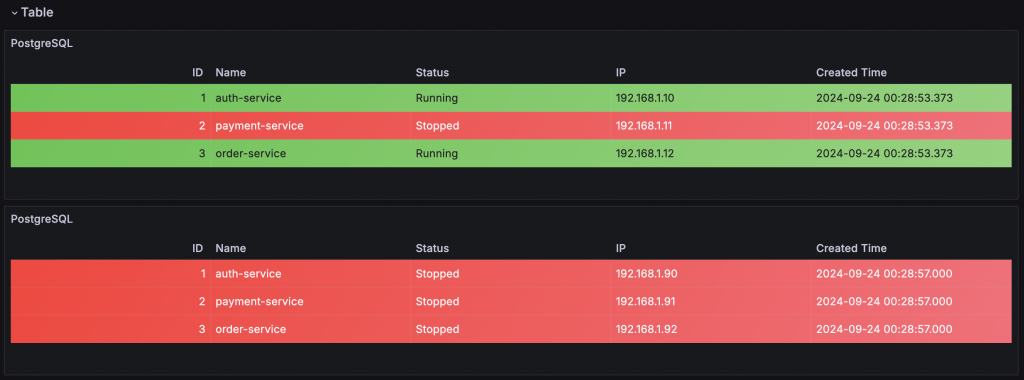
資料庫資料最基本的呈現方式就是表格,透過 Override 功能,能針對不同欄位設定單位、Threshold 等,進而提升資料的可讀性與視覺效果。
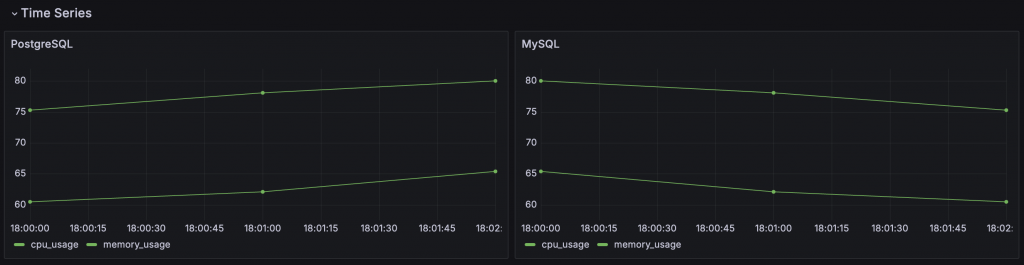
如果資料庫中儲存有時間序列資料,透過 Transform 改變欄位格式,便可使用 Time Series 視覺化數據變化。
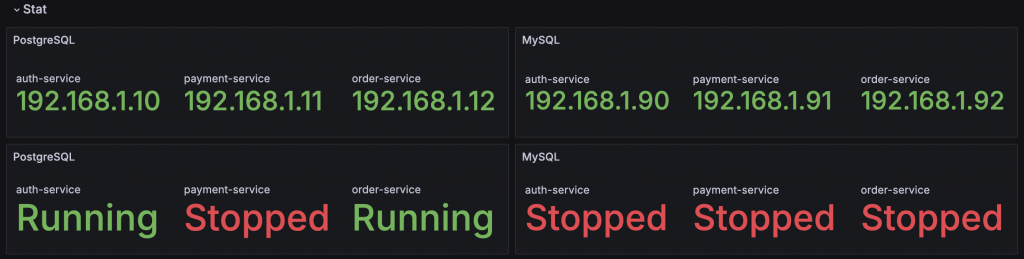
Stat 適合顯示文字或數字,尤其在需要快速呈現數據庫內的關鍵資訊時非常實用。
Grafana 更常與關聯式資料庫搭配的應用場景是監控關聯式資料庫。這時我們會使用針對不同服務的 Prometheus Exporter,Exporter 會採集目標系統的資訊,並將其轉換為 Prometheus Metrics,例如 PostgreSQL 使用的 PostgreSQL Exporter 和 MySQL 使用的 MySQL Server Exporter。
這些 Exporter 通常都有對應的 Dashboard 可供搭配使用,例如 PostgreSQL Statistics 和 MySQL Exporter Quickstart and Dashboard。
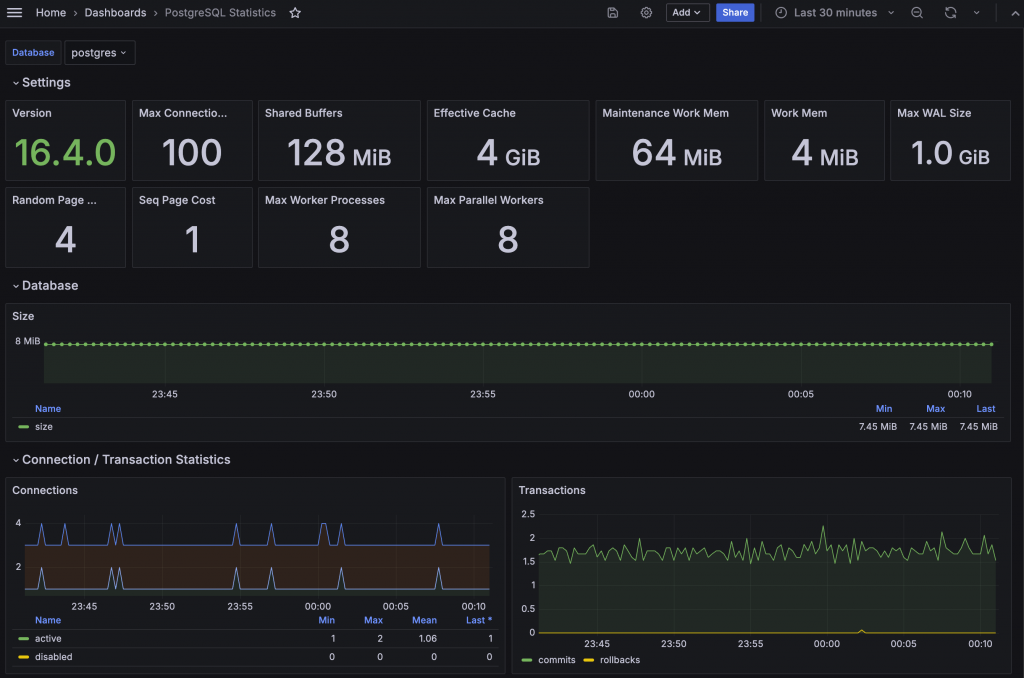
PostgreSQL Monitoring
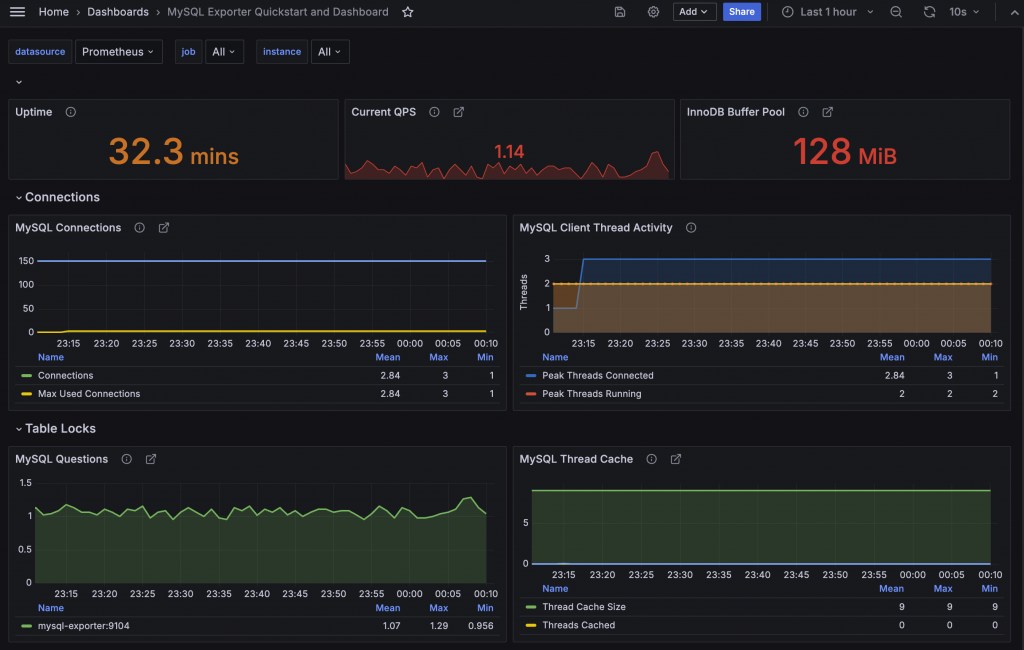
MySQL Monitoring
範例程式碼:https://github.com/blueswen/grafana-zero-to-hero/tree/main/04-datasource/03-db
此 Lab 會建立
啟動所有服務
docker-compose up -d
檢視服務
admin/admin
關閉所有服務
docker-compose down