設定完 Alerting Rule 後,需要搭配良好的通知機制與內容,才能讓告警發揮真正的作用。接下來將介紹各種與通知有關的內容。
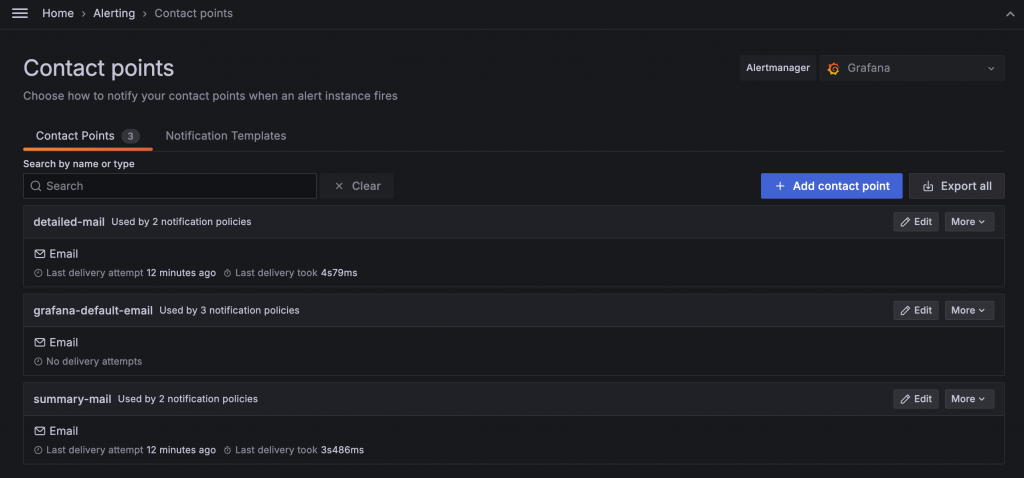
在 Grafana Alerting 中觸發的各種通知稱為 Contact Point,可以在 Alerting 的 Contact Points 頁籤中新增與管理。預設會有一組 Email Contact Point。通知的種類除了基礎的 Email 外,還包含 Line、Slack、Discord、Teams、Telegram 等多種通訊軟體,也有 Kafka REST Proxy 或 Webhook 等機制可以串接其他服務。
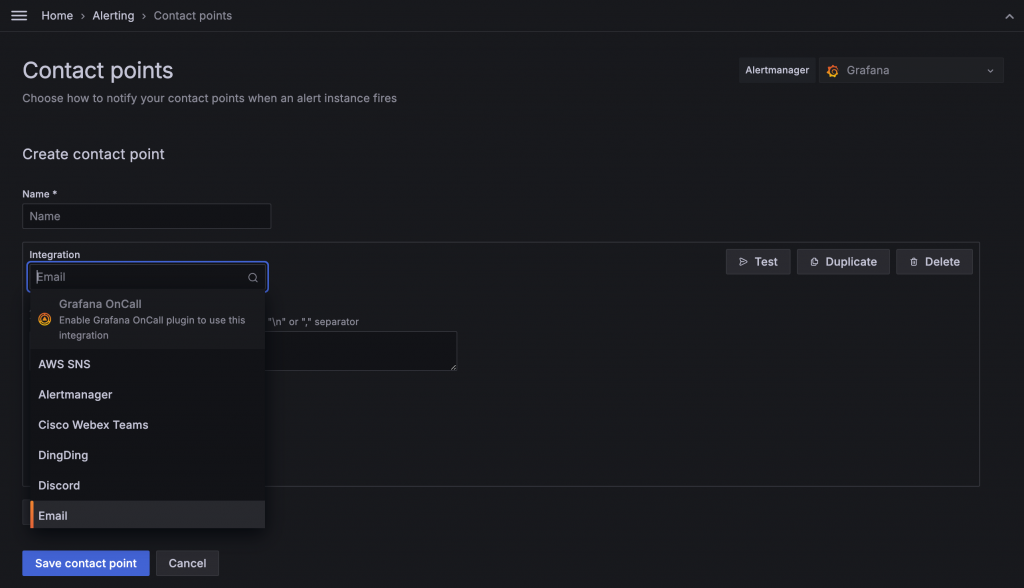
以最基礎的 Email 為例,Grafana Alerting 透過 SMTP(Simple Mail Transfer Protocol)發送電子郵件。可以使用自建的 SMTP Server,或者使用 Gmail 提供的 SMTP Server。設定方式是在 Grafana ini 設定檔中啟用 SMTP:
[smtp]
enabled = true
host = smtp.gmail.com:587
user = [gamil account]
password = [google app password]
from_address = "alert@grafana.demo.com"
from_name = "Grafana"
skip_verify = true
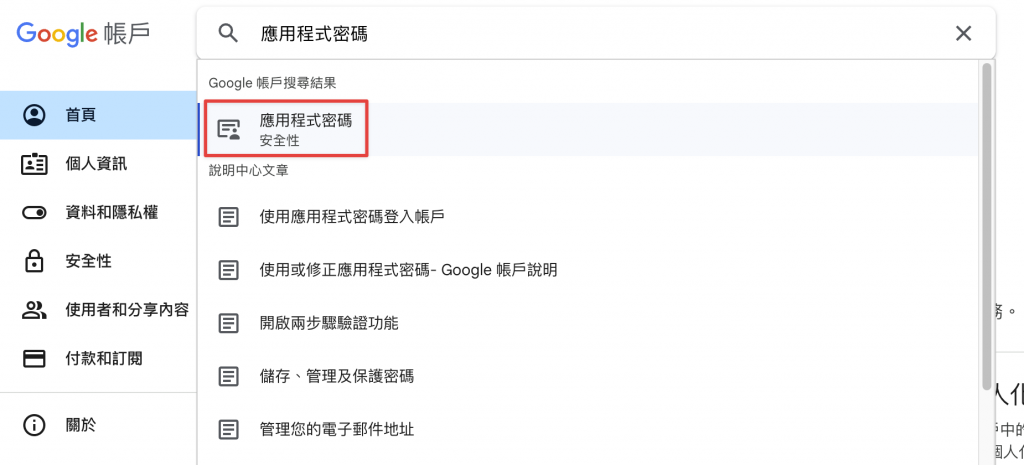
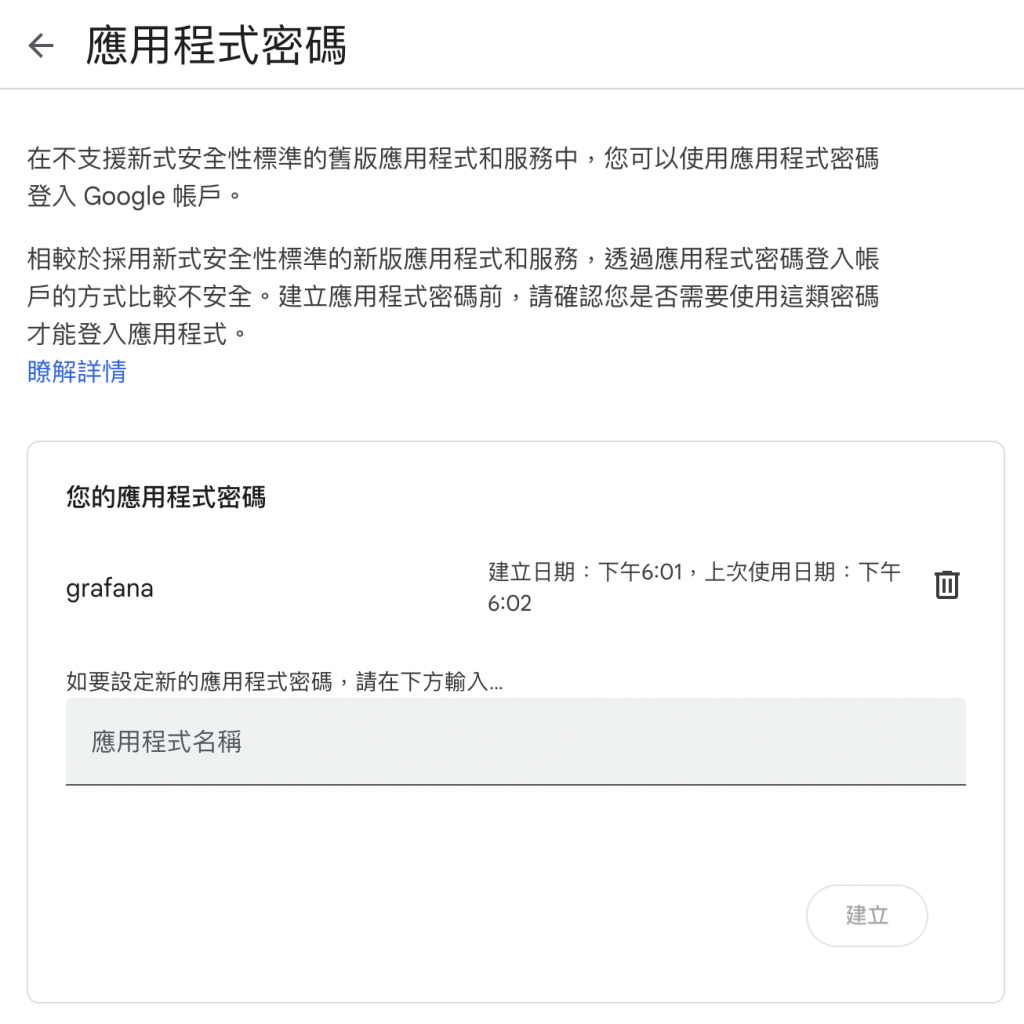
當使用 Gmail 的 SMTP 時,設定檔中的 password 使用的是 App Password。可以在 Google 帳號管理中搜尋 應用程式密碼 或 App Password 即可建立。
設定完成並重啟 Grafana 後,Alert 的電子郵件將以設定的帳號作為寄件者發送。
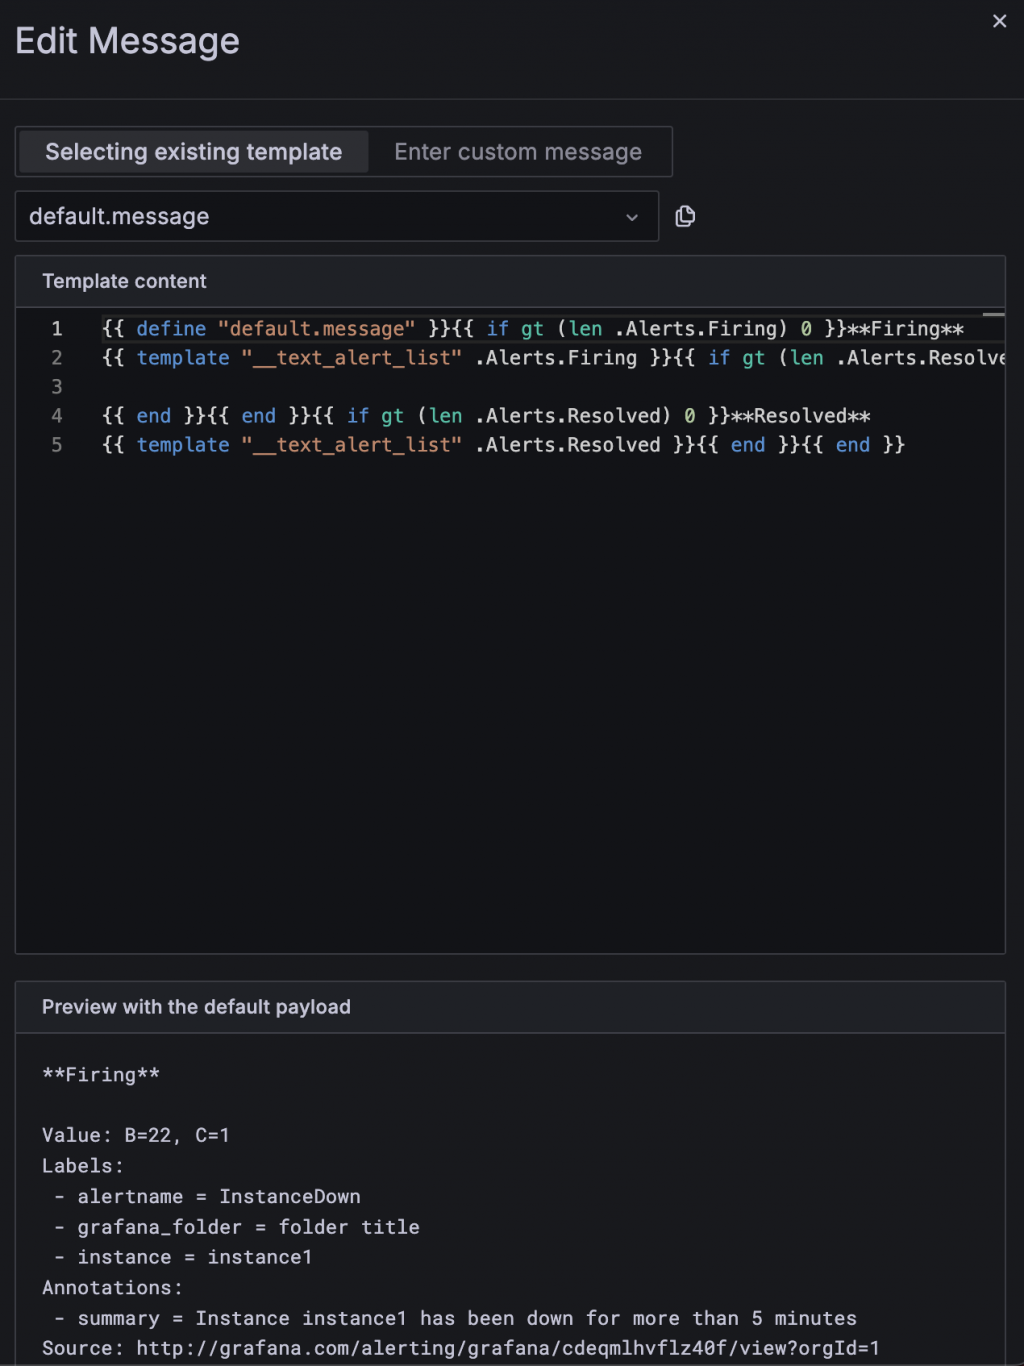
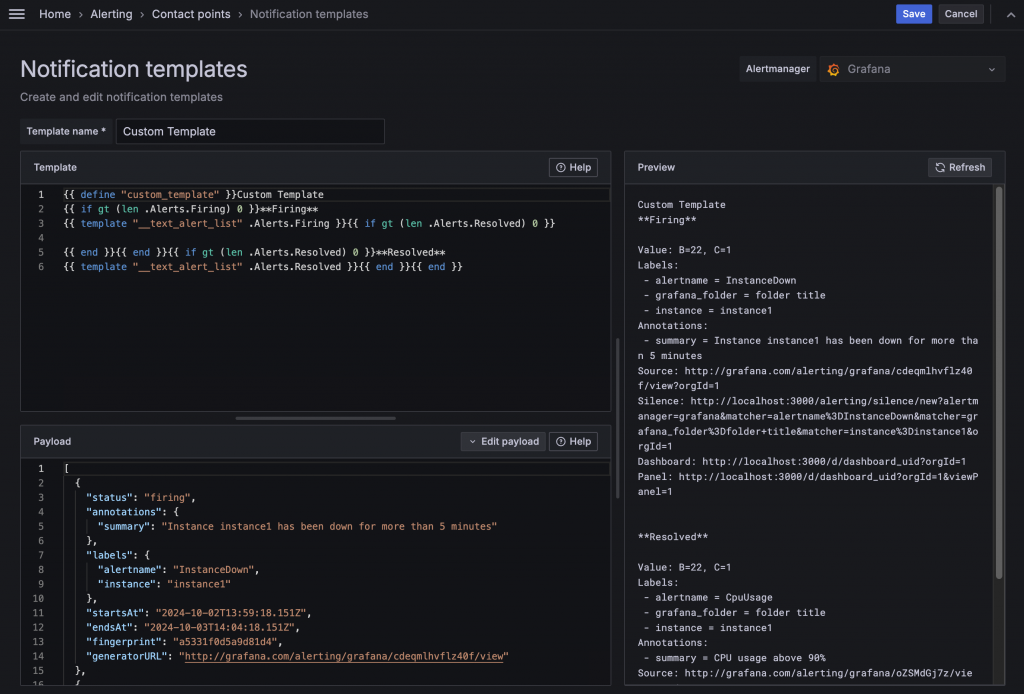
Alerting 的通知內容會依照 Contact Point 中設定的 Template 結合當下 Alert 的內容生成,包括 Alert 的名稱、狀態、Query 與 Expression 的值、連結的 Dashboard 與 Panel 等。Template 使用 Go 的 templating language 撰寫。預設有多種已經定義好的 Template,如 __subject、__text_values_list、__text_alert_list、default.title、default.message,其內容可以參考 default_template.go。
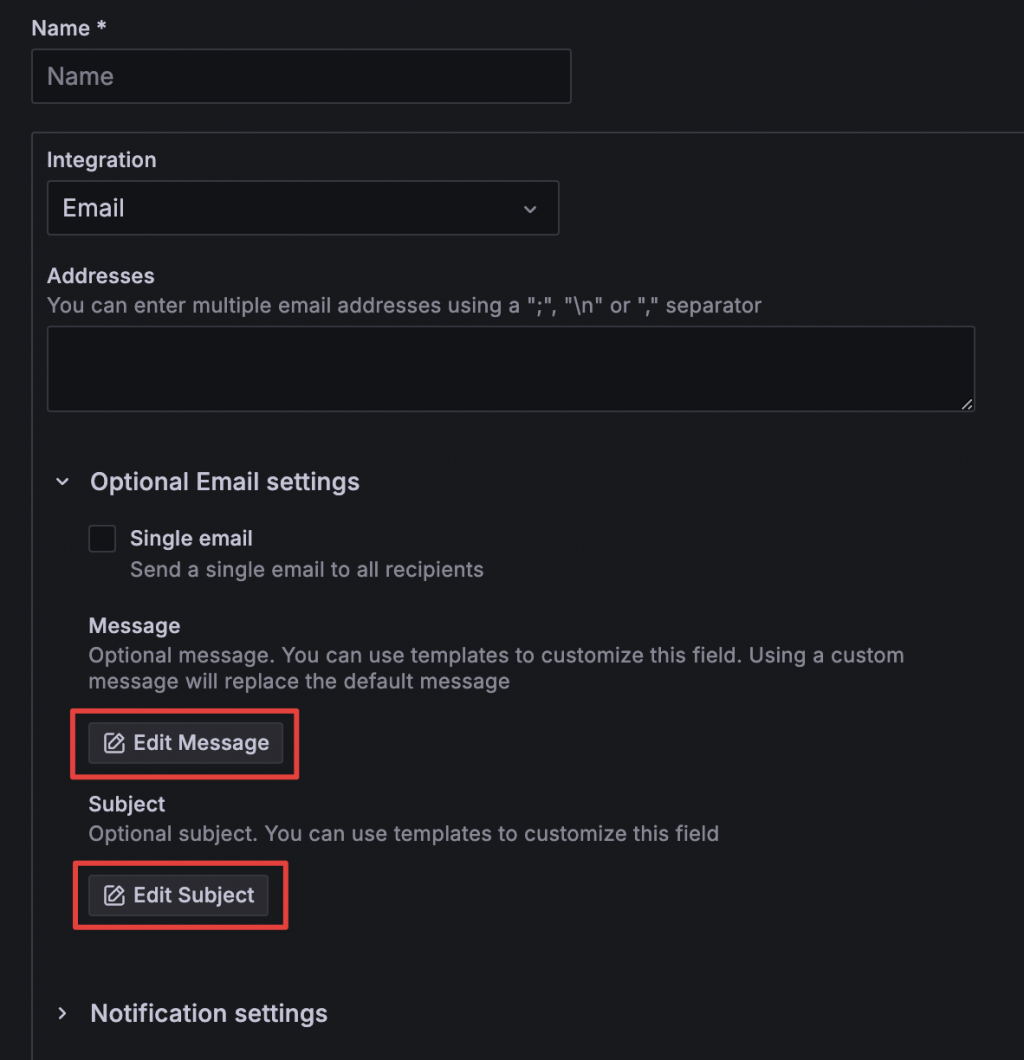
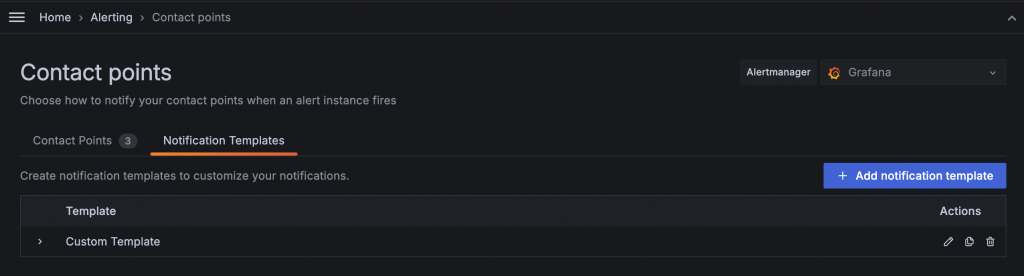
除了直接在 Contact Point 中編輯 Template 外,也可以在 Notification Templates 中新增共用的 Template,這樣就可以在多個 Contact Point 中重複使用。
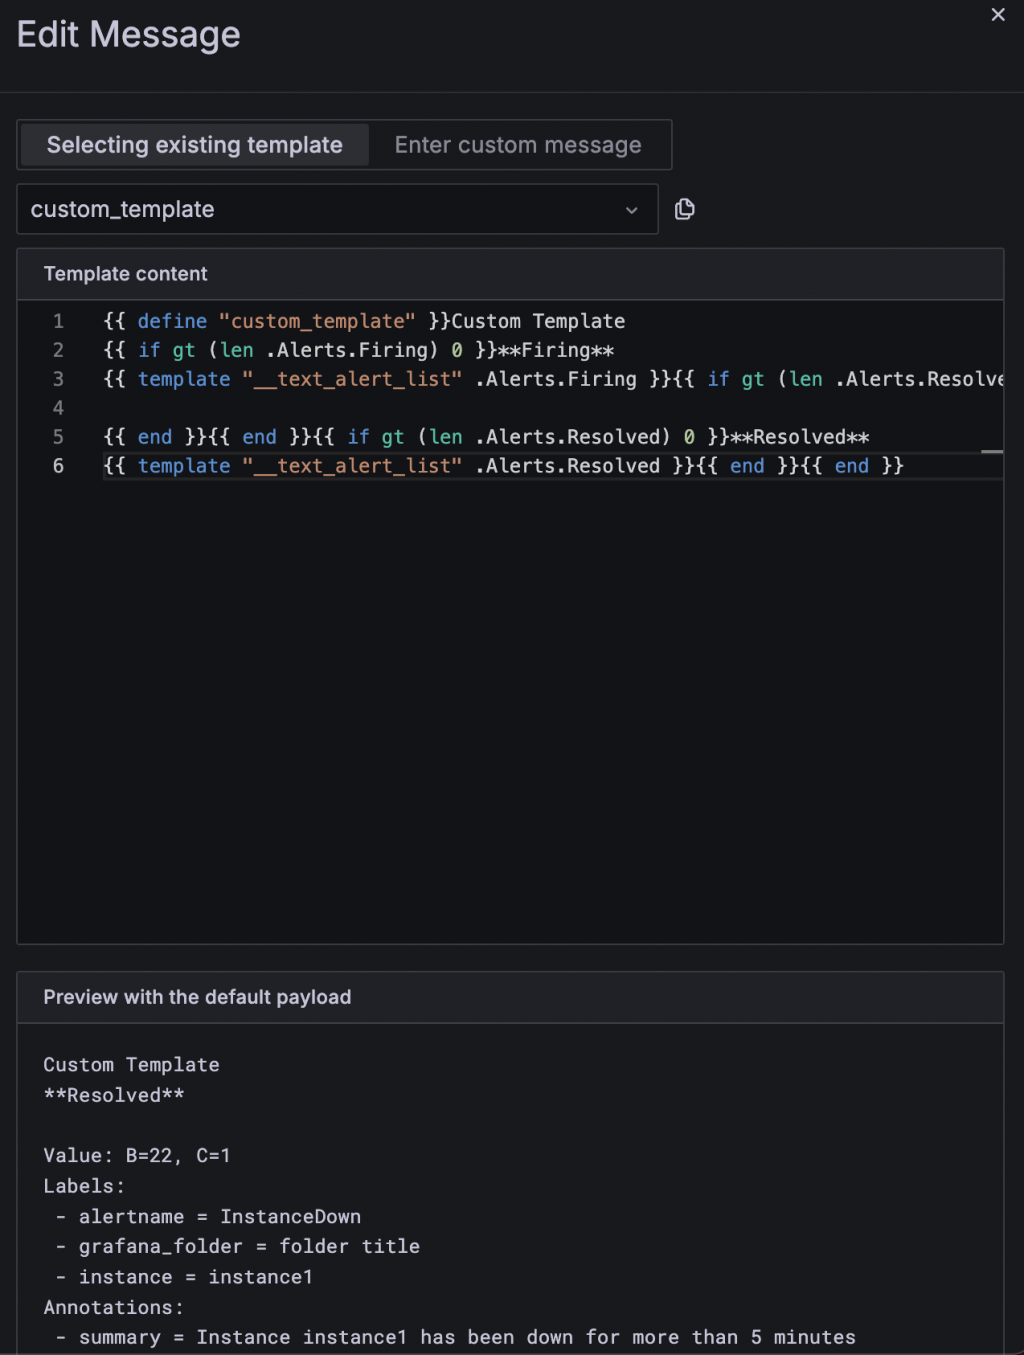
Email 使用的 Template 與其他 Contact Point 略有不同,擁有更豐富的 UI 設計。如果使用自訂的 Template,部分內容會變為純文字顯示。若想保留原本的樣式同時進行客製化,可參考 Grafana Repository 中的 emails 設定,修改 alerting 目錄下的內容後重新編譯,並將其放入 Grafana 的 public emails 目錄中,例如在 Container 中是 /usr/share/grafana/public/emails。
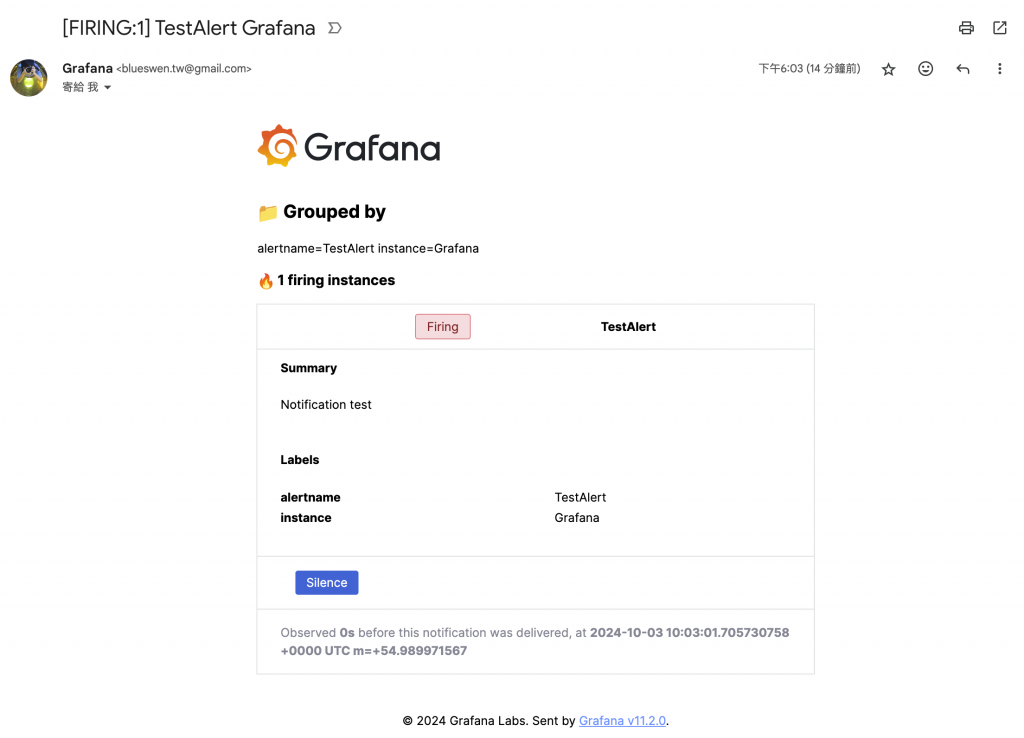
使用 Template 的 Mail
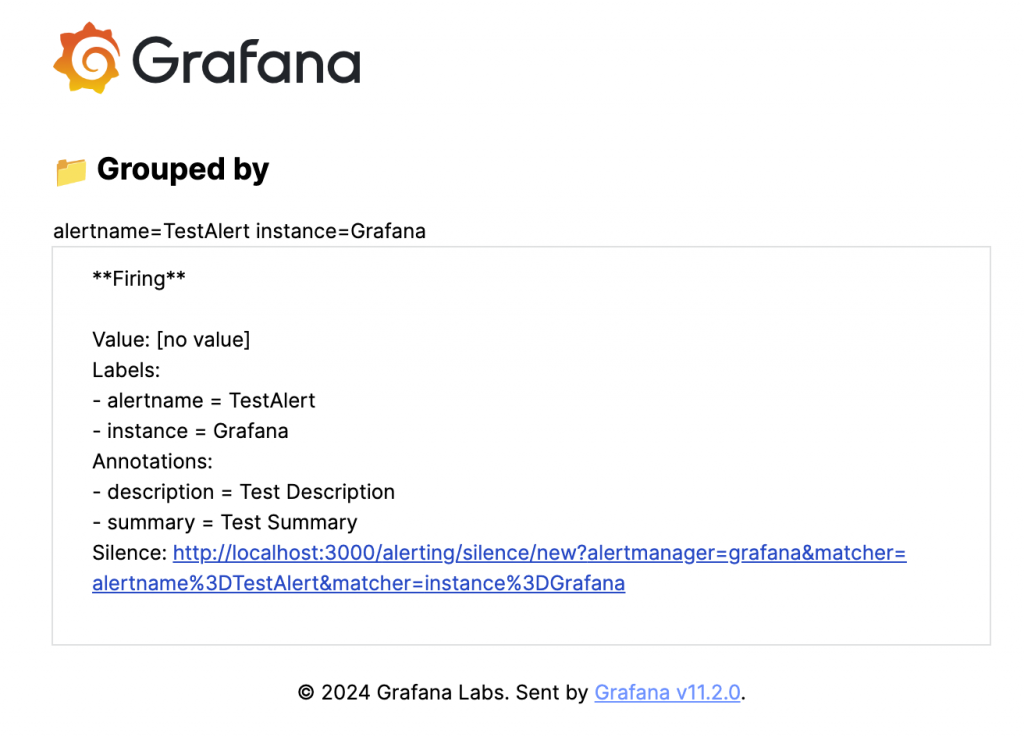
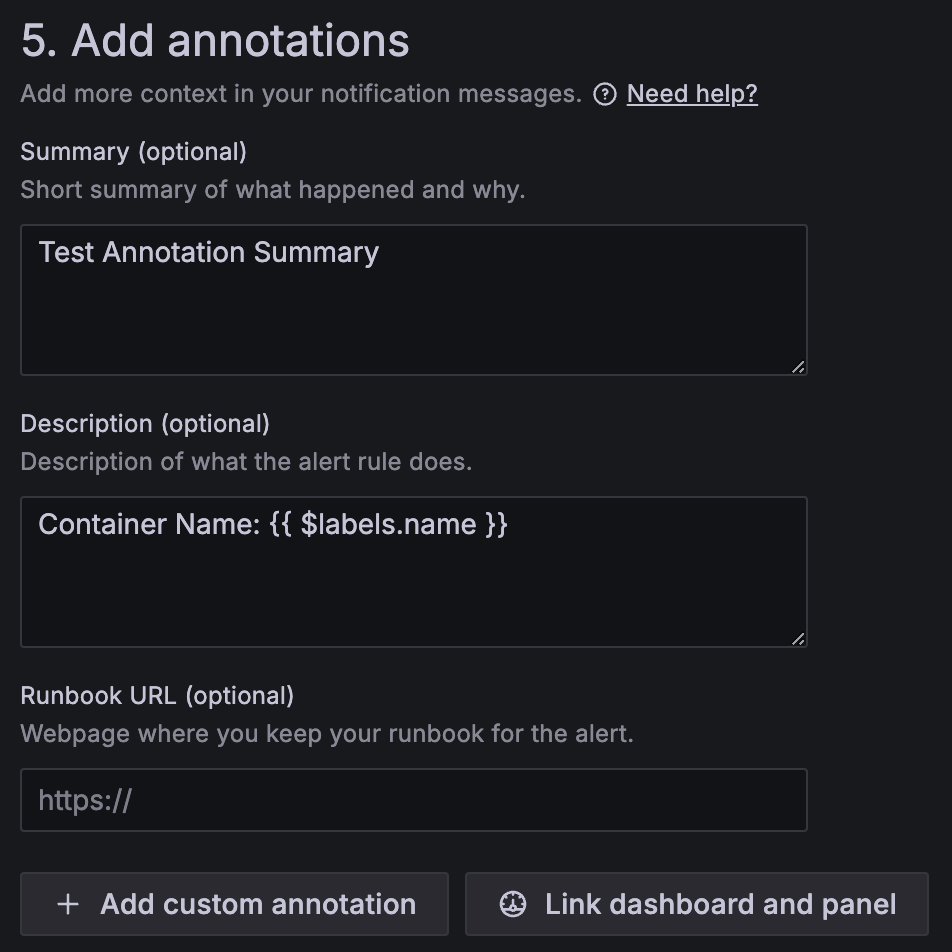
如果想要添加更多資訊,但不想修改原本的 Template,可以使用 Alerting Rule 中的 Annotation 功能,預設的 Template 會協助生成內容,同樣可以使用 Variable 來添加動態資訊。
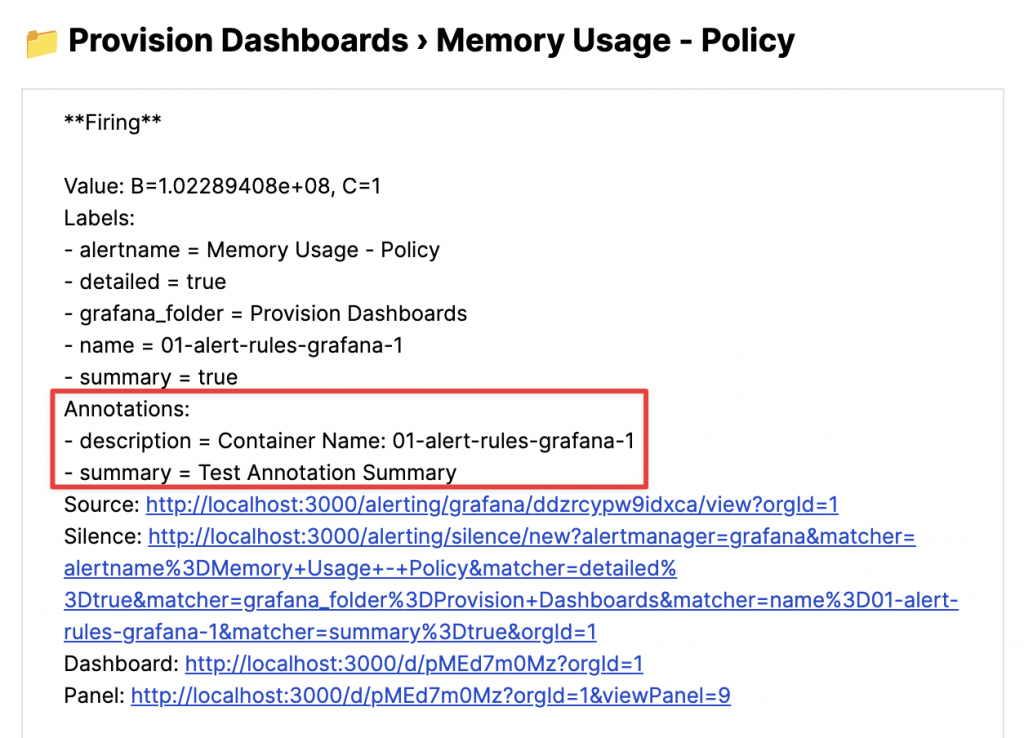
含有 Annotation 資訊的通知
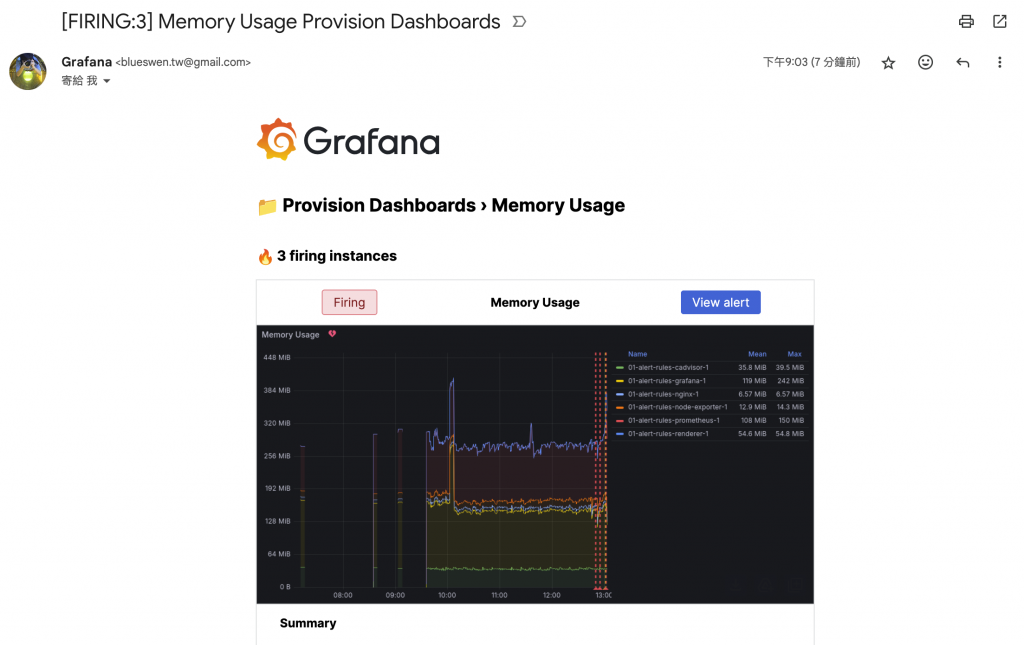
雖然告警通知能顯示許多資訊和 Dashboard 連結,但如果能直接顯示圖片,可以更快地了解狀況。Alerting 提供了 Image 的功能,能透過 Image Renderer 截取 Panel 的圖片並附在通知中。但需要注意的是,並非所有 Contact Point 都支援圖片,例如 Line 就不支援此功能,詳細清單可以參考文件。
若要啟用 Image 功能,需在 Grafana ini 設定檔中啟用 unified_alerting.screenshots 並設定 rendering:
[unified_alerting.screenshots]
capture = true

[rendering]
server_url = http://renderer:8081/render
callback_url = http://grafana:3000/
除了設定外,也需要啟動 Image Renderer 的服務,它是作為一個獨立的服務運作,並不包含在 Grafana 中,可以用 Plugin 或 Container 的方式啟動。一般來說,透過 Container 方式建立可以更好地控管資源使用。設定完成並重啟 Grafana 後,支援圖片的 Contact Point 就會自動添加截圖,Contact Point UI 上無法單獨設定開關 Image 功能。
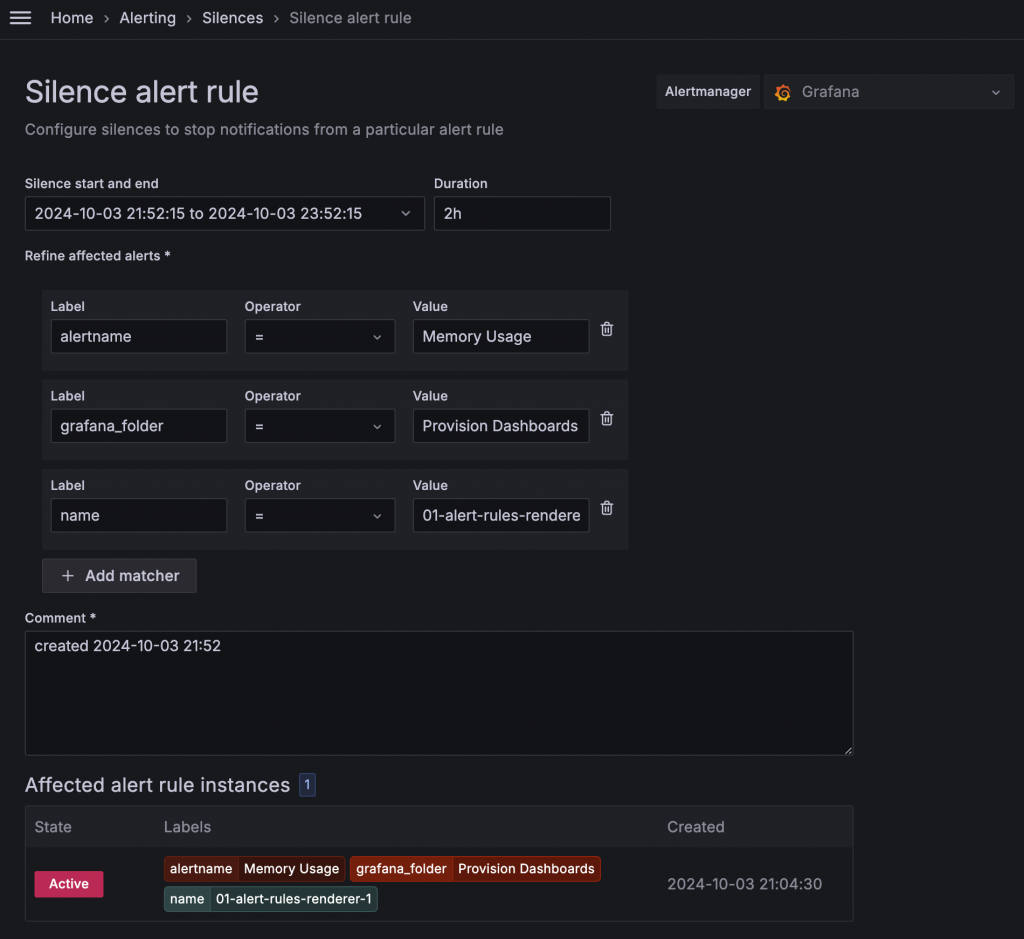
隨著系統或服務的擴展,告警的次數也會隨之增加。有些事件正在處理或暫時可以忽略時,若還是持續收到告警,可能會造成混亂,甚至忽略真正需要處理的問題。使用 Silences 功能,可以暫時將指定的告警靜音一段時間,超過時間後會恢復告警,避免問題被長期忽略。
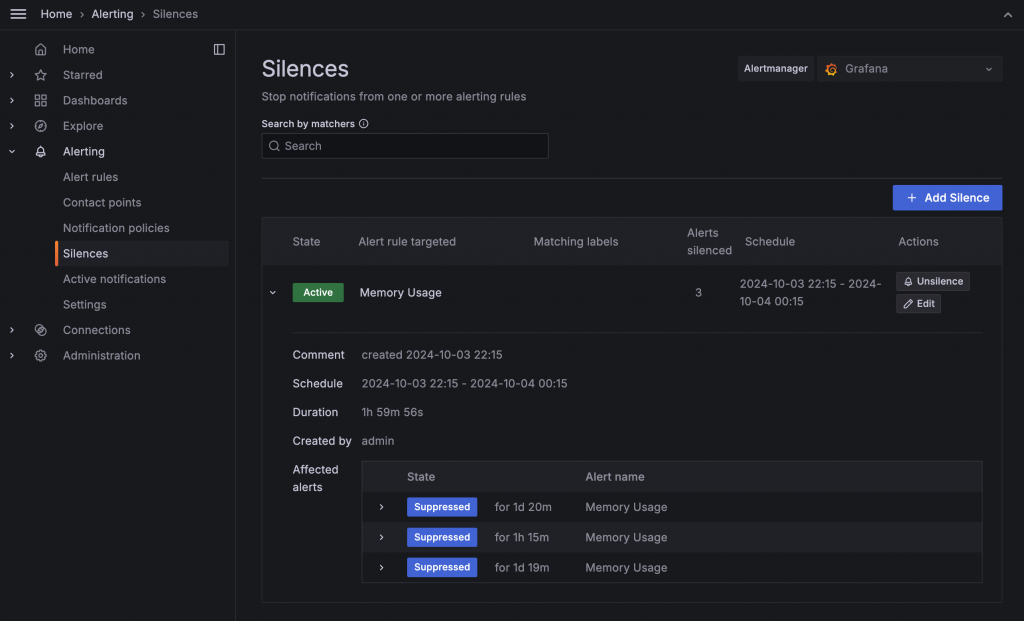
目前啟用 Slilences 的清單
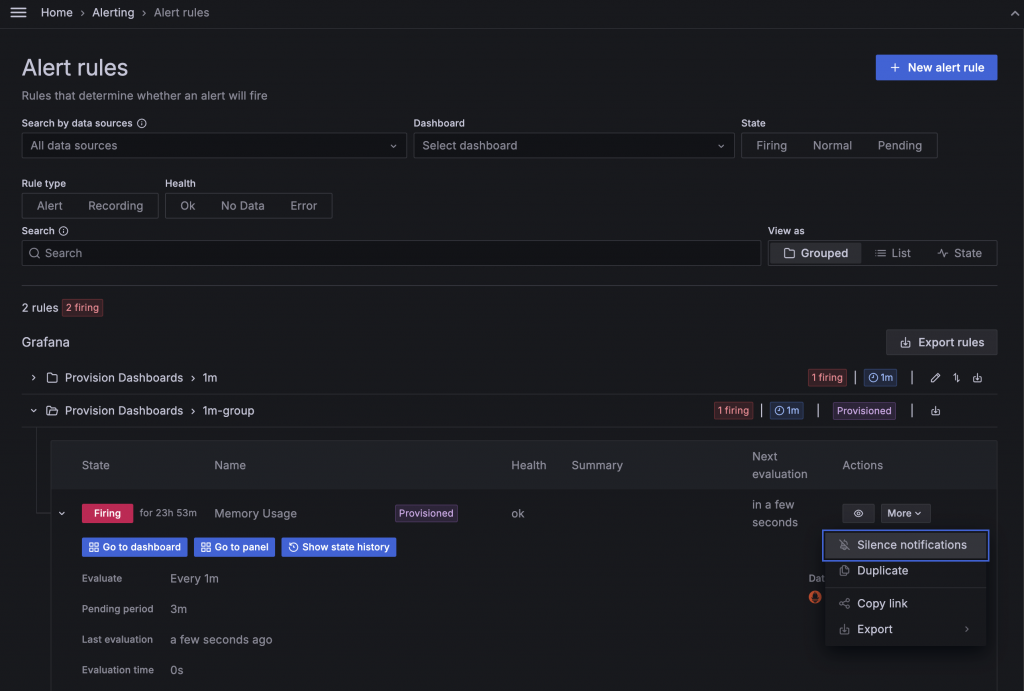
直接在 Alert Rule 新增 Silences
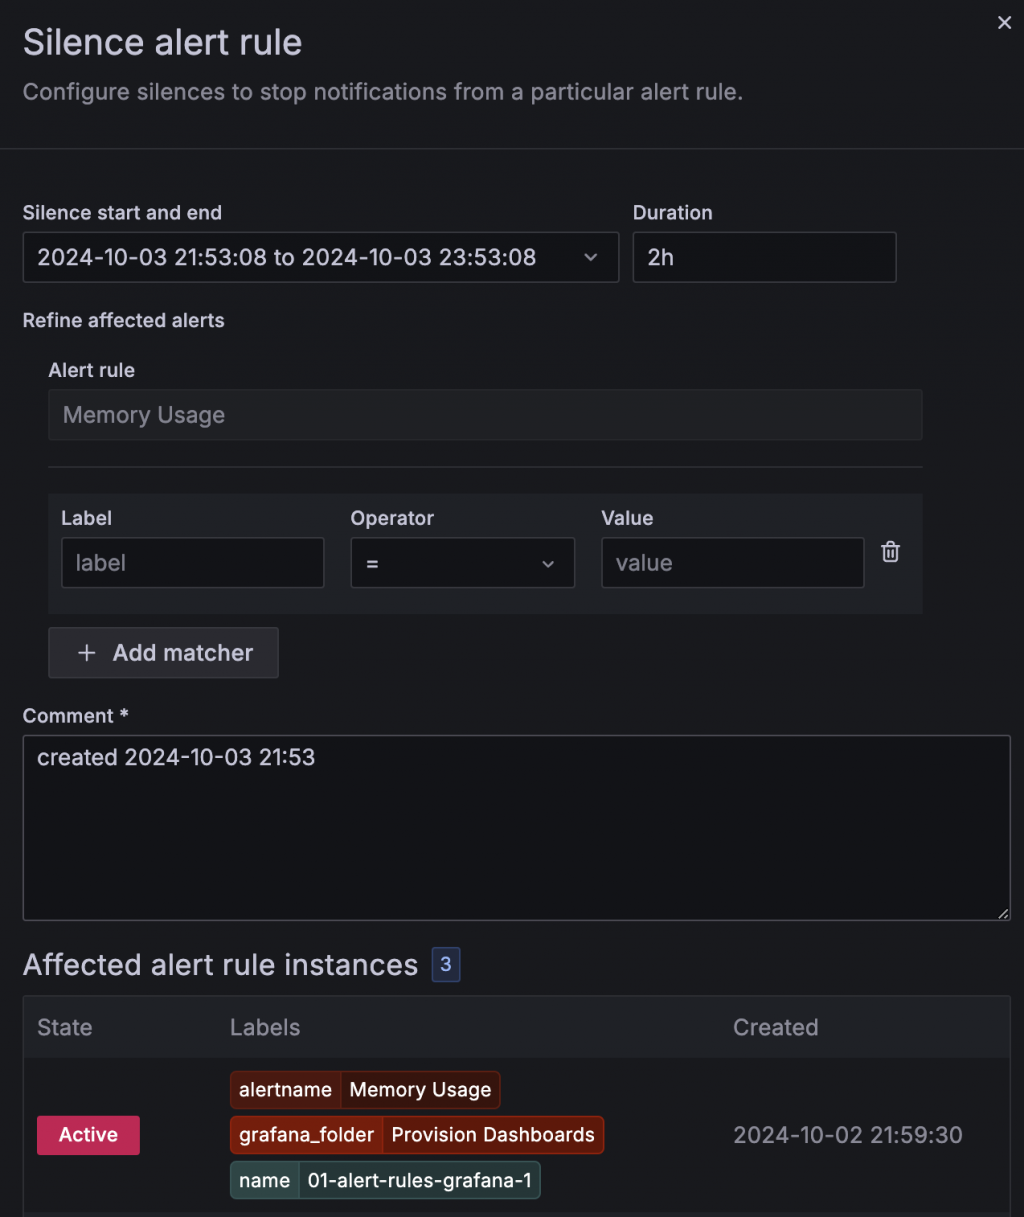
Silences 的設定需要手動設定
除了手動在 Alert Rule 頁面設定 Silences 外,預設的告警通知中通常會包含 Silences 的 URL,點擊後會自動帶入該 Alert 的篩選參數,準確地靜音目標。
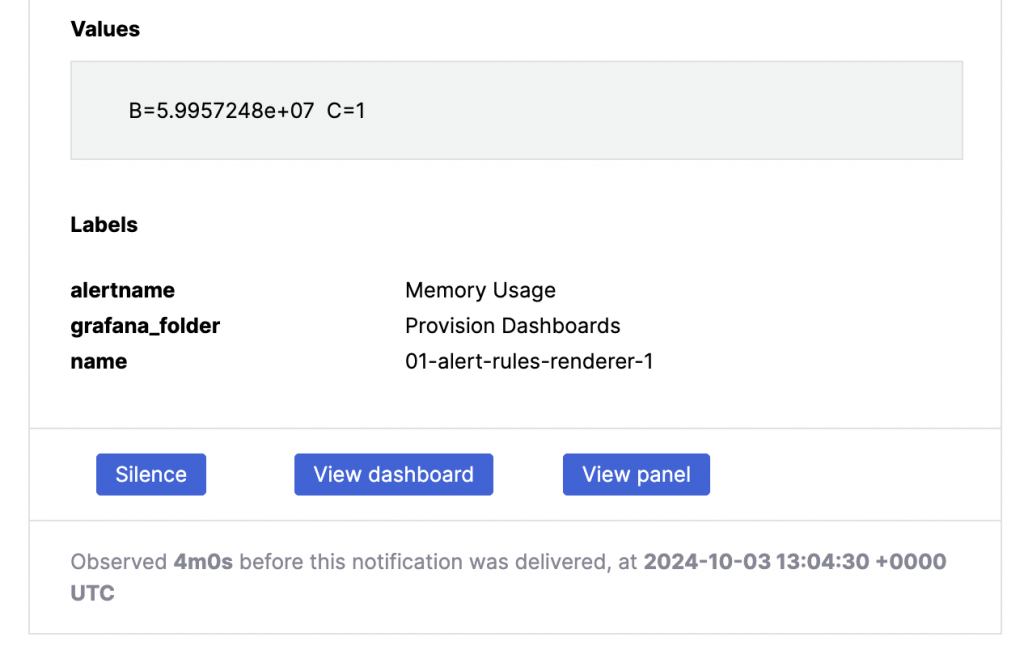
告警通知中的 Silences 連結
連結的 Silences 設定會自動帶入該 Alert 的篩選參數
在 Alert Rule 中只能設定一個 Contact Point,但如果有些告警希望用不同的方式通知給不同的人,或者同時觸發多種通知方式,這時候可以使用 Notification policies。Alert 可以設定多組 Label Pair,並選用 Notification Policy 作為通知方式,符合建立好的 Notification Policy 的 Alert 會套用該 Policy 的 Contact Point。這樣就能讓一個 Alert 觸發多個不同的通知方式。
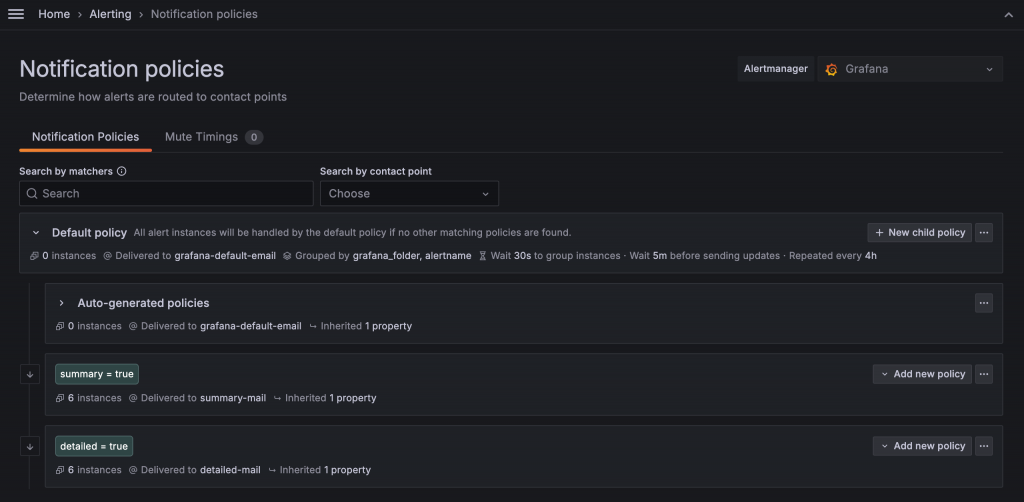
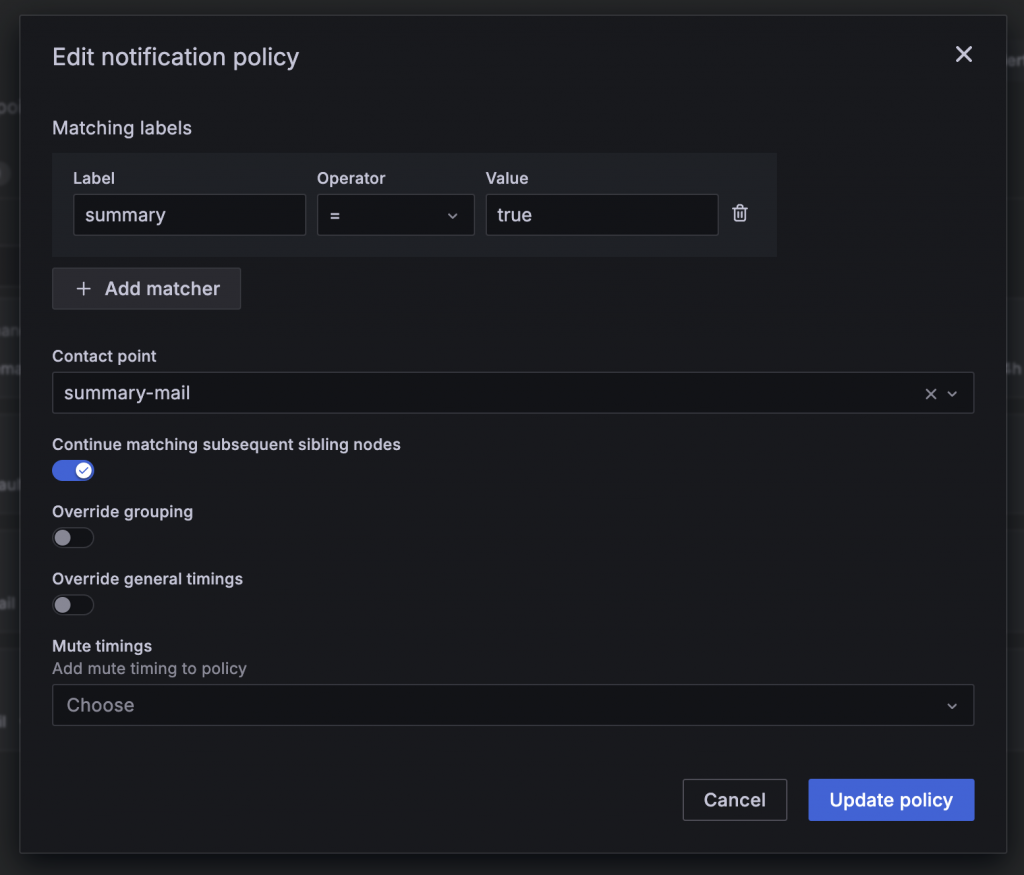
如果要讓 Policy 繼續往下判斷,不要因為有符合條件就停止,必須勾選 Continue matching subsequent sibling nodes
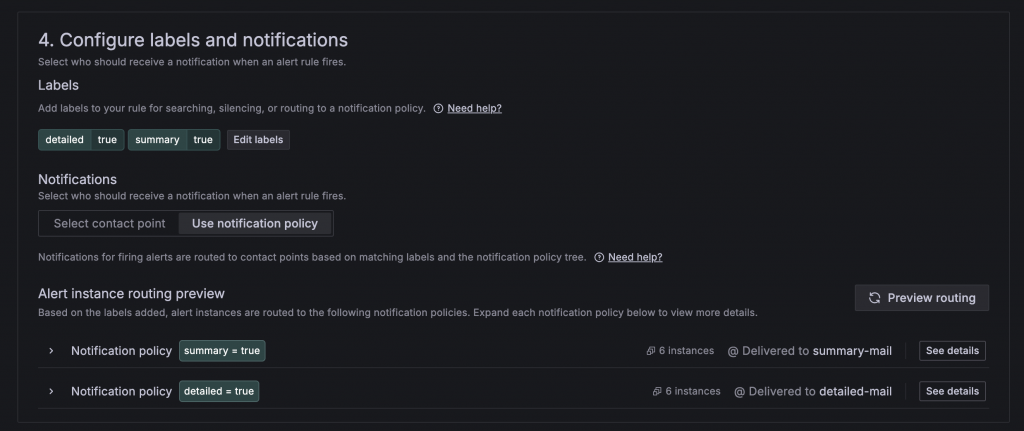
在 Alert Rule 中透過 Preview Routing 可以看到套用到兩個不同的 Policy
範例程式碼:https://github.com/blueswen/grafana-zero-to-hero/tree/main/06-alerting/01-alert-rules
此 Lab 會建立
複製 etc/grafana/grafana.ini.template 為 etc/grafana/grafana.ini 並更新其中 smtp 的 username 與 password,password 需使用 Google Account 的應用程式密碼
更新 etc/grafana/alerting/contact-points.yaml 中的 example@email.com 為自己的 Email
啟動所有服務
docker-compose up -d
檢視服務與 Alert 設定
admin/admin
關閉所有服務
docker-compose down