在進入資料探索的初步階段,多半先透過視覺化來掌握趨勢與分布。但光靠圖表往往只能提供「表象」,若要進一步驗證資料間的關係是否真的存在,需要借助 統計方法。統計檢定所呈現的數字,不僅能告訴我們「有沒有差異」、「差異是否顯著」,更重要的是提醒我們:顯著不代表實質影響力。
延續昨天對於音樂受歡迎程度 (popularity) 與音樂元素的觀察,今天進入 統計驗證階段,嘗試透過 ggstatsplot 套件將「視覺化」與「統計數字」結合。
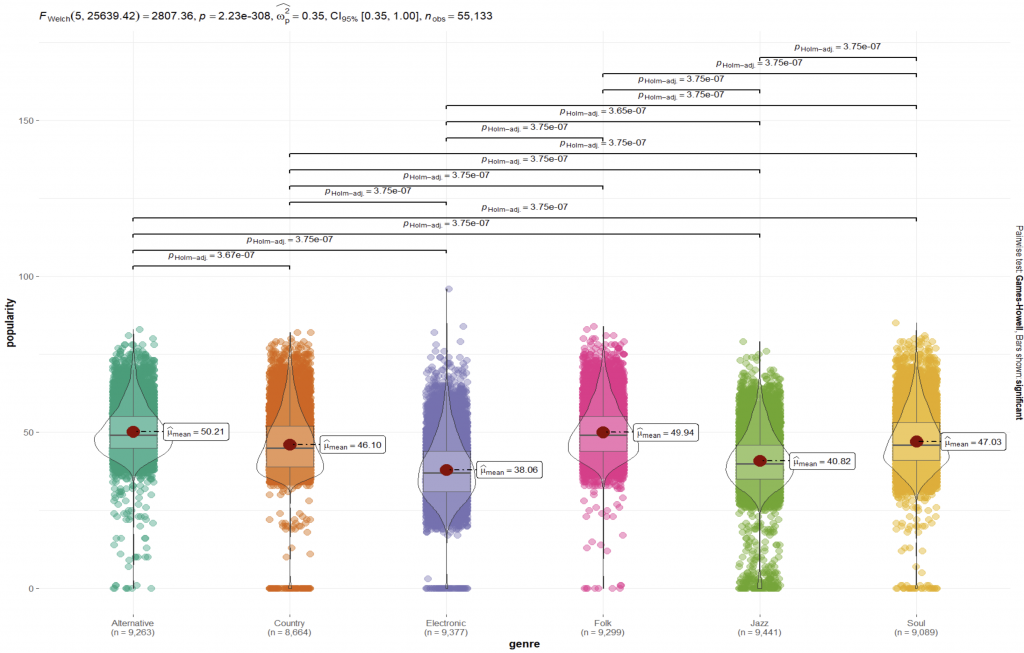
首先,利用 Violin plot 描述不同音樂類型的受歡迎程度分布,並透過內建的 Welch ANOVA 與事後比較檢定,直接呈現各類型間是否達到統計上差異:
ggbetweenstats(data = spotify_2,
               x = genre,
               y = popularity)
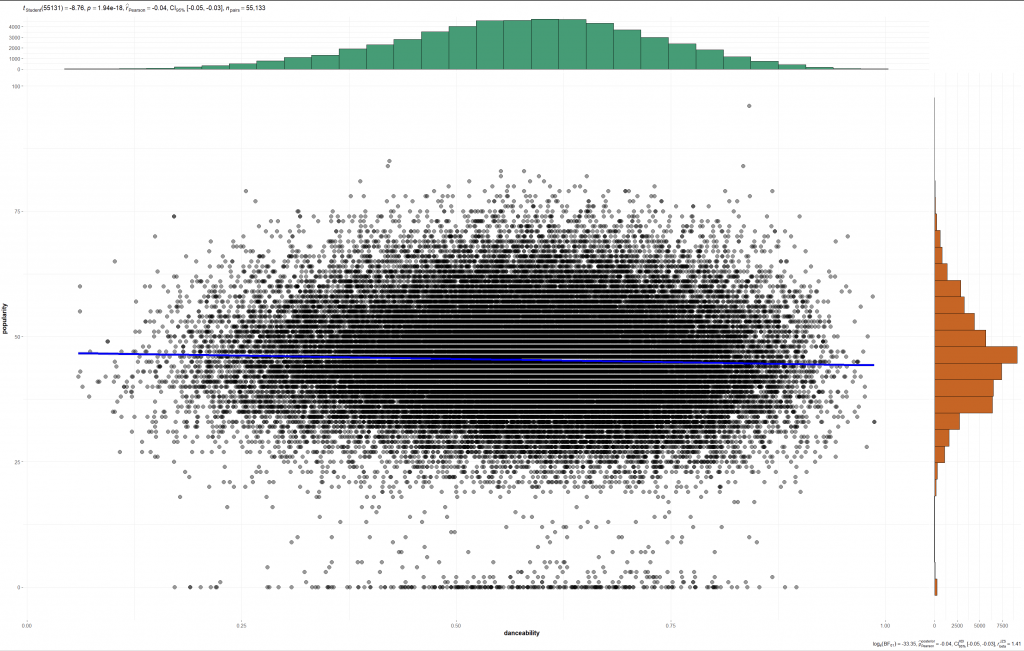
接著觀察 舞曲性 (danceability) 與 受歡迎程度 (popularity) 的關係。圖上分布看似沒有明顯趨勢,但檢定結果卻顯示顯著相關。然而,實際相關係數僅約 -0.04。這提醒我們:大樣本下容易達到統計顯著,但實際影響極低。
ggscatterstats(data = spotify_2,
               x = danceability,
               y = popularity)
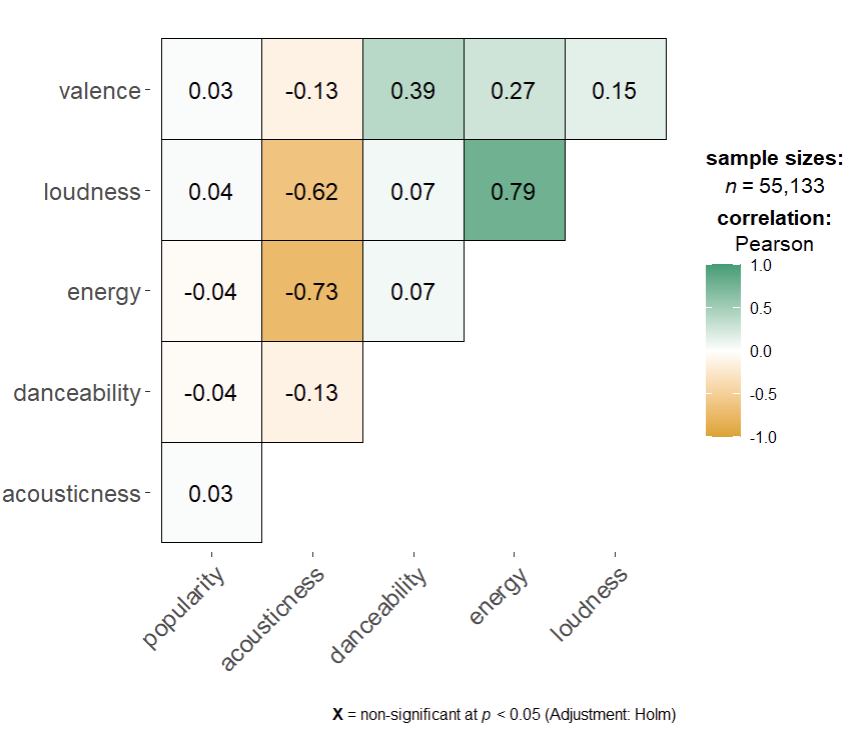
進一步檢視多個聲學特徵間的關聯性,發現像是 energy 與 loudness 有高度正相關,而 acousticness 與 energy 呈負相關。這些結果說明 聲學特徵彼此之間有強烈連動,但 popularity 與它們的關聯卻非常弱。
spotify_2 %>%
  select(popularity, acousticness, danceability,
         energy, loudness, valence) %>%
  ggcorrmat()
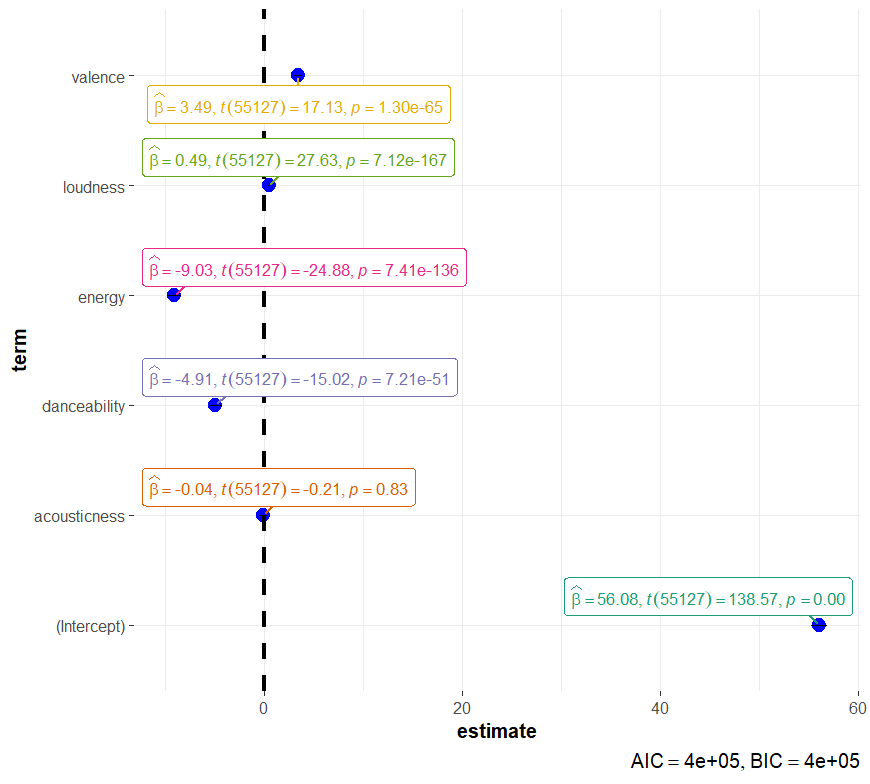
最後,建立多元迴歸模型檢驗各元素對 popularity 的影響。雖然 danceability、energy、loudness、valence 在統計上顯著,但整體模型 R² 僅約 0.02,代表這些特徵加總起來僅能解釋 2% 的受歡迎程度變異,其實相當有限。
spotify_lm <- lm(formula = popularity ~
                   acousticness + danceability +
                   energy + loudness + valence,
                 data = spotify_2)
summary(spotify_lm)
ggcoefstats(spotify_lm)
今天的統計驗證提醒:數字上的「顯著差異」並不等於實質上的「影響力」。雖然音樂的聲學特徵在檢定中顯示顯著,但實際上它們對受歡迎程度的解釋非常有限。真正影響 popularity 的,可能是宣傳、社群文化、平台演算法等外部因素。這也是數據分析有趣之處! 有時候,挖掘到的「真相」就是證明了某些假設並不成立。
In this post, we move from visual exploration to statistical verification using the ggstatsplot package. By combining visualization with statistical testing, we examine the relationship between musical features and song popularity. Violin plots with Welch’s ANOVA reveal significant differences across genres, while scatterplots suggest a statistically significant yet practically negligible correlation between danceability and popularity (r ≈ -0.04). A correlation matrix further shows that acoustic features are strongly related to each other (e.g., energy and loudness), but their connection with popularity remains weak. Finally, a multiple regression model confirms that although features like danceability, energy, loudness, and valence are statistically significant predictors, the overall explanatory power is extremely low (R² ≈ 0.02). These findings highlight the critical distinction between statistical significance and practical significance. In large datasets, even tiny effects may become significant, but this does not necessarily imply meaningful explanatory power. The results suggest that song popularity is likely shaped more by external factors such as promotion, cultural trends, or platform algorithms rather than acoustic properties alone.


 iThome鐵人賽