ggplot2 能滿足多數基本視覺化需求;當遇到標籤重疊、高密度散點、互動、內建統計檢定、或多圖拼版等進階場景時,extension 套件能把「做得到」變成「做得漂亮而且有效率」。在「合併圖形」面向,patchwork 是最順手的解方。本文先盤點這陣子用到的擴充套件與應用情境,接著重點介紹 patchwork 的排版語法,以及 area(t, l, b, r) 的設計與解讀。
| 套件 | 核心用途 | 常見場景 | 關鍵使用 |
|---|---|---|---|
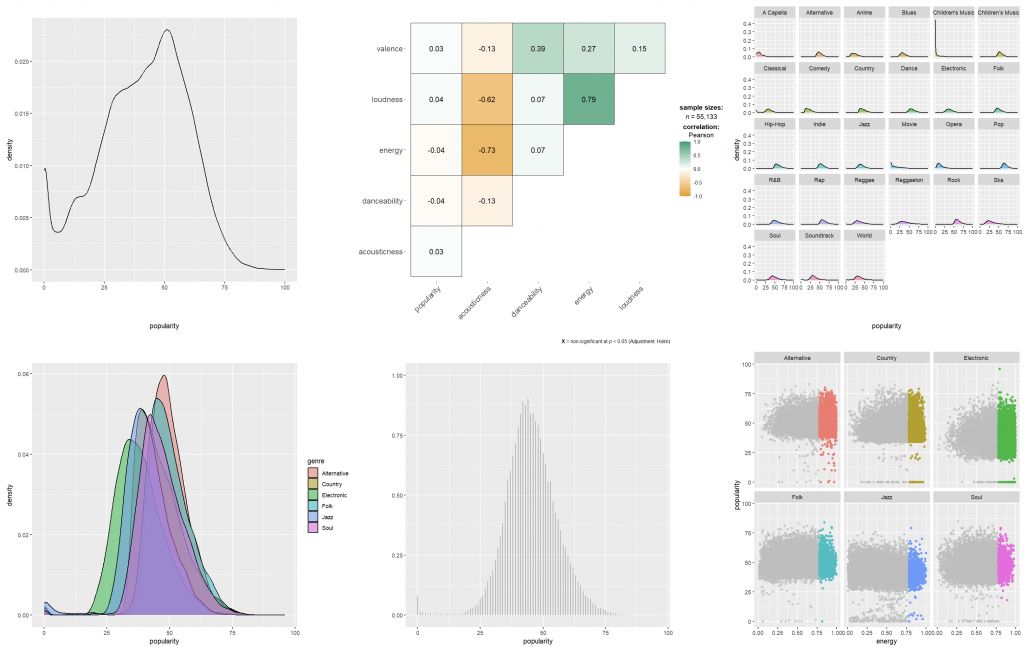
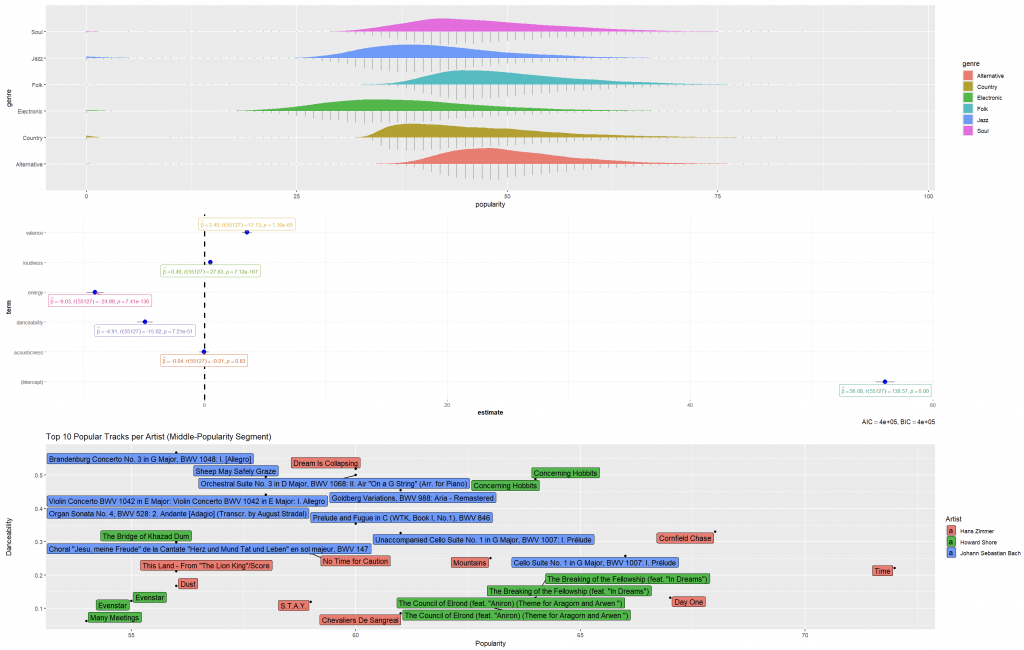
| ggrepel | 智慧排斥文字標籤 | 散點圖加標註、避免重疊 | geom_text_repel() / geom_label_repel() |
| ggpointdensity | 以顏色表達點雲密度 | 大量散點、overplotting 嚴重 | geom_pointdensity() |
| gghighlight | 以條件凸顯關鍵資料 | 凸顯門檻/規則、敘事重點 | gghighlight(x > 0.7, calculate_per_facet = TRUE) |
| ggiraph | 互動式 ggplot(tooltip/hover/click) | 審查與簡報需要「滑過看細節」 | geom_*_interactive() + girafe() |
| ggstatsplot | 視覺化 + 統計檢定 | 群組比較、關聯檢驗 | ggbetweenstats() / ggscatterstats() |
| patchwork | 多圖拼版、插圖、排版 | 儀表板、報告佈局、合併多視角 | `p1 |
ggiraph 適合非程式使用者的互動檢閱;ggstatsplot 適合「圖 + 檢定」的一次到位;patchwork 則負責把多張好圖合成為可閱讀的版面。
p1 | p2(左右並排)、p1 / p2(上下堆疊)plot_layout()、widths/heights、design = area()
inset_element() 疊放子圖、Logo、說明框plot_annotation() 統一標題、註記、標籤序號plot7 / plot8 / plot9
[ plot7 ]
[ plot8 ]
[ plot9 ]
plot7 + plot8 + plot9
+ 同時也是 ggplot 的加圖層運算子,為避免混淆,建議改用 |。[ plot7 ][ plot8 ][ plot9 ]
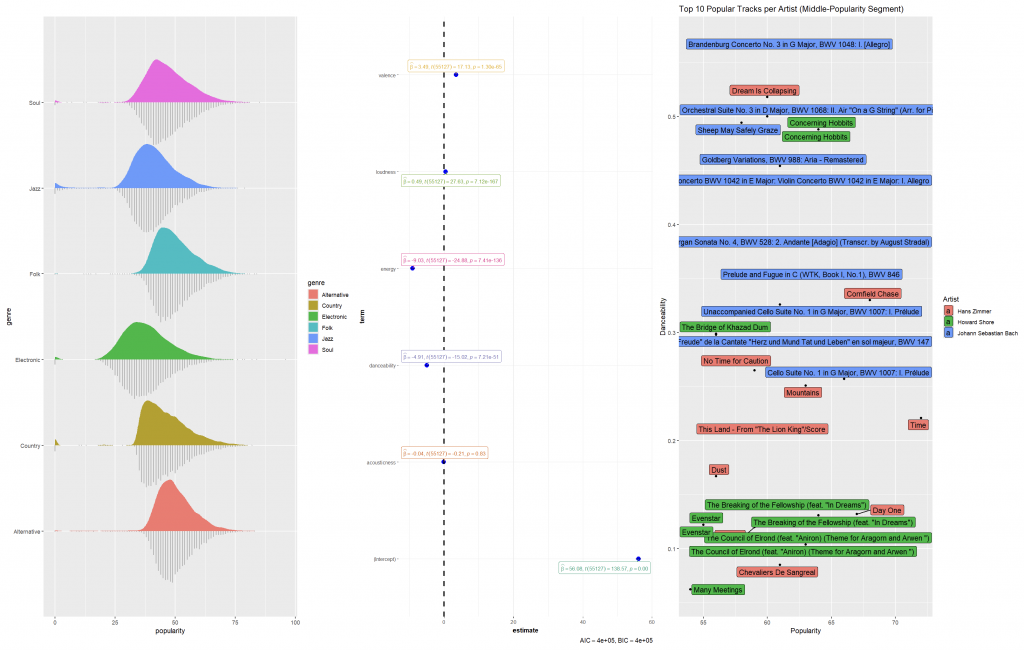
(plot7 + plot8) / plot9
plot7 與 plot8 併成第一列,再把 plot9 置於第二列且橫跨全寬。[ plot7 ][ plot8 ]
[ plot9 ]
plot_layout(widths = c(...), heights = c(...)) 微調列高與欄寬。area():自訂網格、跨列跨欄的關鍵area(t, l, b, r) 定義一個矩形區塊:
網格大小由所有區塊共同決定:
- 總列數 rows = max(b)
- 總欄數 cols = max(r)
library(patchwork)
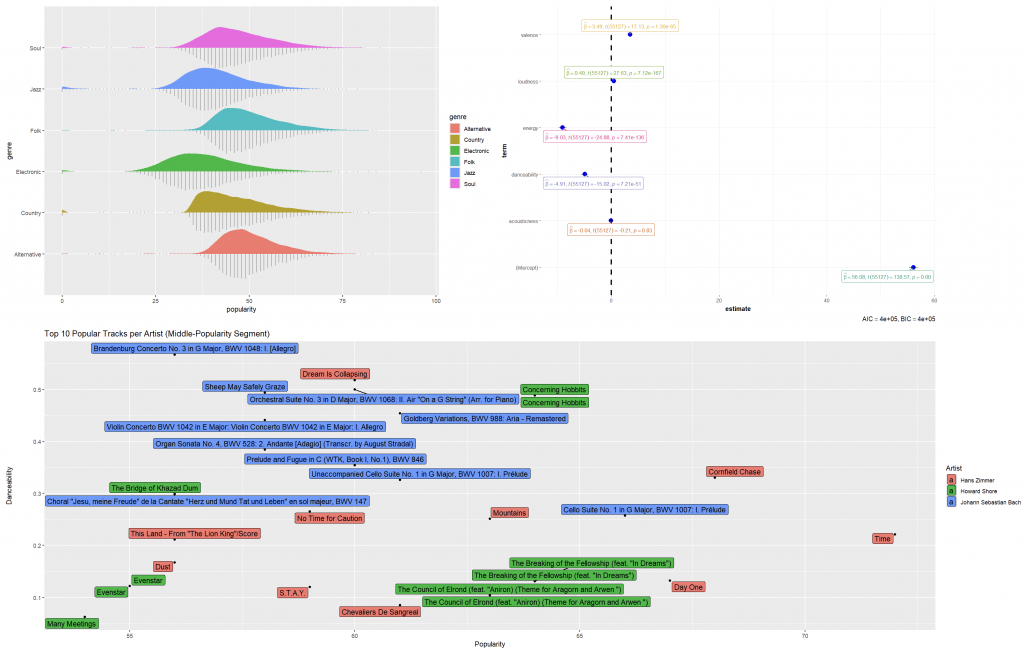
design <- c(
area(t = 1, l = 1, b = 1, r = 3), # A:第 1 列、跨 1~3 欄
area(t = 1, l = 4, b = 2, r = 5), # B:跨第 1~2 列、4~5 欄
area(t = 2, l = 3, b = 2, r = 3) # C:第 2 列、第 3 欄
)
pA + pB + pC + plot_layout(design = design)
輸出解讀:
3 patch areas, spanning 5 columns and 2 rows
    t l b r
1:  1 1 1 3   # A:第 1 列、1~3 欄
2:  1 4 2 5   # B:第 1~2 列、4~5 欄
3:  2 3 2 3   # C:第 2 列、第 3 欄
因此 max(b) = 2 → 2 行;max(r) = 5 → 5 欄。
A <- area(1,1,1,1); B <- area(1,2,1,2); C <- area(1,3,1,3)
D <- area(2,1,2,1); E <- area(2,2,2,2); F <- area(2,3,2,3)

design_2x3 <- c(A, B, C, D, E, F)

plot1 + plot2 + plot3 +
plot4 + plot5 + plot6 +
  plot_layout(design = design_2x3)
這一輪 Extension 系列的核心,是把「視覺化的需求」對上「正確的工具」。當標籤擠成一團,用 ggrepel 讓文字自動避讓;當散點多到看不清,用 ggpointdensity 以顏色呈現點雲濃度;當想強調重點,用 gghighlight 以規則凸顯;需要互動審查,用 ggiraph 補上 tooltip 與點選;需要在圖上同時交付「結果+檢定」,用 ggstatsplot;面對不確定性與分布形狀,交給 ggdist;而當這些圖都做好了,最後一公里的版面整合,就交給 patchwork:先用 | 與 / 迅速定型,再以 plot_layout() 與 area() 精修跨列跨欄的結構,必要時用 inset_element() 疊上小圖或 Logo。這樣的工作流,能把多視角的分析結果轉換成可閱讀、可比較、且美觀一致的成品頁。
This post wraps up my recent “Extension” mini-series by mapping common visualization needs to the right ggplot2 companions: ggrepel for non-overlapping labels, ggpointdensity for dense scatterplots, gghighlight for rule-based emphasis, ggiraph for interactive review, ggstatsplot for visuals with built-in tests, and ggdist for uncertainty displays. The final mile is layout: patchwork composes multiple views into a coherent page. Use intuitive operators (| for horizontal, / for vertical), then refine with plot_layout() and custom grids via area(t, l, b, r), where total rows equal max(b) and columns equal max(r). I show practical patterns—pure stacks and rows, a split layout (plot7 + plot8) / plot9, an asymmetric 2×5 grid, and a standard 2×3 board—plus when to add inset_element() for local overlays. This workflow turns individually strong plots into a readable, comparable, and polished multi-panel figure.


 iThome鐵人賽