

建立系統的靈魂之窗,觀測所有資源指標。
單體架構下,SSH 進伺服器跑一次 htop 就能看到全貌。微服務架構下,同一個系統可能拆成十幾個 Pod、分布在不同節點,而且隨時因為 Deployment 的 rolling update 或 HPA 縮擴容而生滅。逐台檢查不可行,需要一個集中收集所有服務指標 (Metrics) 的系統。
Prometheus 負責收集與儲存這些時序數據,Grafana 負責把數據畫成圖表。這是目前 K8S 生態圈最主流的監控組合。
Prometheus 採用 Pull 模式:它主動去每個服務的 /metrics 端點抓資料,而不是等服務推送過來。專案裡 monitoring/prometheus-config.yaml 定義了抓取規則:
scrape_configs:
  - job_name: 'api-gateway'
    metrics_path: /metrics
    kubernetes_sd_configs:
      - role: pod
        namespaces: { names: ['k8sdemo'] }
    relabel_configs:
      - source_labels: [__meta_kubernetes_pod_label_app]
        regex: api-gateway
        action: keep
      - source_labels: [__meta_kubernetes_pod_ip]
        target_label: __address__
        replacement: ${1}:8080
kubernetes_sd_configs 讓 Prometheus 透過 K8S API 自動發現 (Service Discovery) 符合條件的 Pod,不需要手動維護 IP 清單——Pod 重啟換了 IP,下一次抓取週期自動抓到新位置。
在本機 K8S 上用 Helm 裝一套精簡版 Prometheus(拿掉不需要的 node-exporter、alertmanager 等元件):
helm install prometheus prometheus-community/prometheus \
  --namespace monitoring --create-namespace \
  --set alertmanager.enabled=false \
  --set prometheus-node-exporter.enabled=false \
  --set kube-state-metrics.enabled=false
API Gateway 的 Deployment 上加了三個 annotation,這是這個 Helm chart 內建的「annotation-based」抓取規則會認的格式:
annotations:
  prometheus.io/scrape: "true"
  prometheus.io/path: /metrics
  prometheus.io/port: "8080"
部署完成後,打開 Prometheus 的 Target 頁面確認抓取狀態:
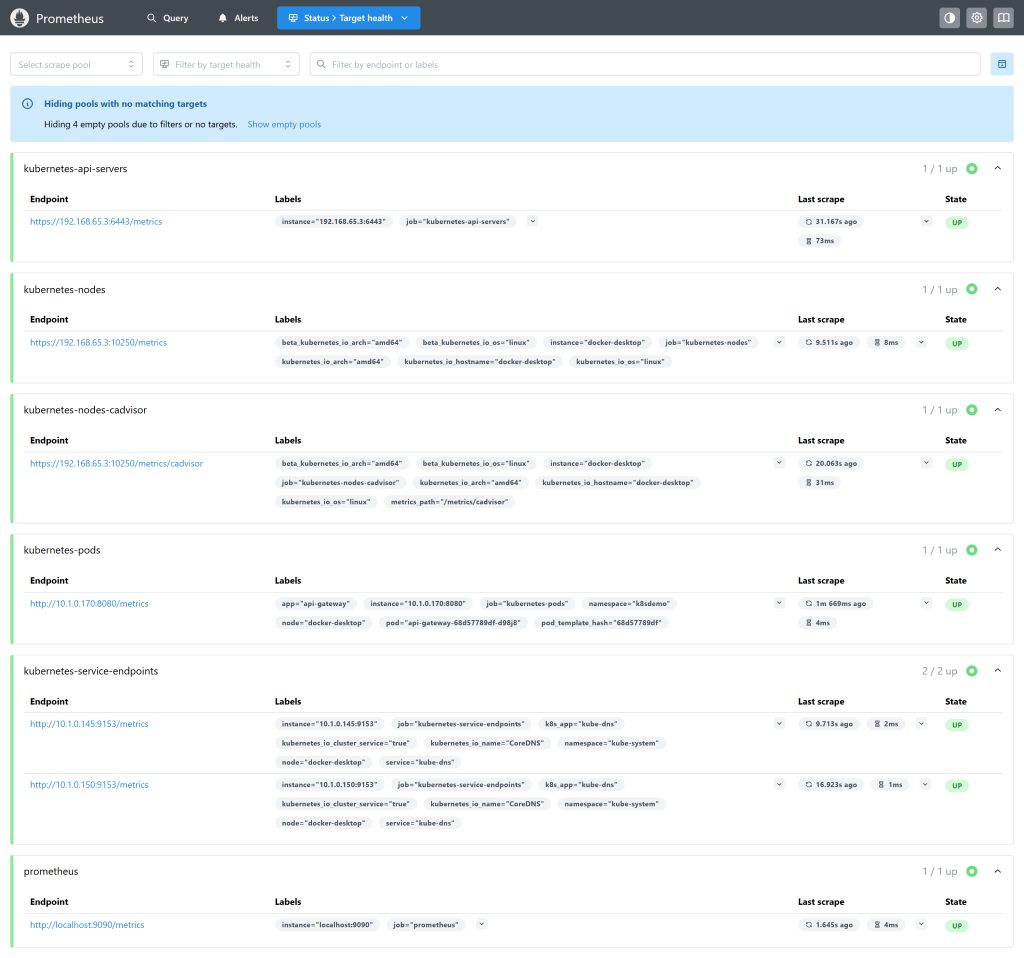
▲ Prometheus Target 健康頁:api-gateway Pod 被正確發現並標記 UP
kubernetes-pods 這個 job 底下顯示了 api-gateway 的實際 Pod IP(10.1.0.170:8080)與完整標籤集(app、namespace、pod),狀態 UP,代表 Prometheus 已經能定期抓到這個 Pod 的指標。
光看 Target 健康還不夠,要確認抓到的資料是我們期待的內容。查詢 http_requests_total(Day 6 API Gateway 裡用 prom-client 暴露的計數器):
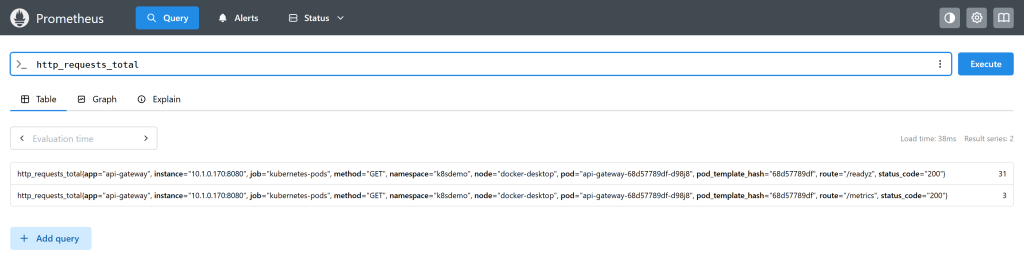
▲ Prometheus Query 頁:查到 api-gateway 實際回報的 http_requests_total 指標
資料裡看得到 route、method、status_code 等標籤,這些是後續 Day 23 畫 RED(Rate/Errors/Duration)儀表板的原始素材。
Prometheus 存的是一堆帶標籤的時序數字,直接看意義不大。Grafana 接上 Prometheus 當資料源後,同一份數據可以用折線圖、長條圖、熱力圖等各種形式呈現,也能設定多個 Panel 組成儀表板。這部分的實際畫面留到 Day 23,先把資料源接上:
curl -X POST http://admin:<password>@grafana:3000/api/datasources \
  -H "Content-Type: application/json" \
  -d '{"name":"Prometheus","type":"prometheus","url":"http://prometheus-server.monitoring.svc.cluster.local","access":"proxy","isDefault":true}'
監控的地基打好了:Prometheus 能自動發現並抓到服務指標,Grafana 接上了資料源。明天實際設計一個遵循 RED 方法論的儀表板,並驗證告警規則能否在真實流量下正確觸發。


 iThome鐵人賽
 看影片追技術