

Chrome DevTool MCP 伺服器的設定非常簡單,但要在我的 MacOS 筆記型電腦上正常運作卻有些困難。最終,我請 AI 幫我解決了這個問題。
"chrome-devtools": {
    "command": "npx",
    "args": ["-y", "chrome-devtools-mcp@latest"]
}
agy
提示模型列出該伺服器的部分工具
List the first three performance tools of the DevTool server
CLI 的輸出結果
 The first three performance-related  tools of the chrome-devtools server are:

  1. performance_analyze_insight
  2. performance_start_trace
  3. performance_stop_trace
這證明了設定是正確的,但並不代表伺服器能夠執行這些工具。
當我提示 CLI 對 http://localhost:5005 進行效能追蹤時,CLI 卡在 Get MCP Tools。
在多次提示模型並嘗試了錯誤的解決方案之後,我們終於找到了一個解決辦法。
這份 架構決策紀錄 (ADR) 詳細說明了這項架構決策。Node.js 指令碼會建立一個 Chrome 偵錯設定檔,覆寫 DevToolsActivePort,並將 9992 偵錯連接埠附加到全新的 Chrome 瀏覽器上。
在 package.json 中新增用來啟動和停止 Chrome 瀏覽器的指令稿
"scripts": {
    ... other scripts ...
    "chrome:debug": "node scripts/chrome-debug.mjs start",
    "chrome:debug:stop": "node scripts/chrome-debug.mjs stop"
}
請完全依照以下步驟操作:
步驟 1:開啟一個獨立的終端機視窗,並執行 npm run chrome:debug
步驟 2:在同一個終端機中開啟一個新分頁,並執行 npm run build && npm run preview 以在本地端執行正式版建置。
步驟 3:將 http://localhost:5005 貼到全新 Chrome 瀏覽器的網址列中
步驟 4:開啟最後一個分頁,並啟動 Antigravity CLI
agy
提示模型執行效能追蹤
Use the Chrome DevTool MCP server to run a performance trace on http://localhost:5005/dashboard
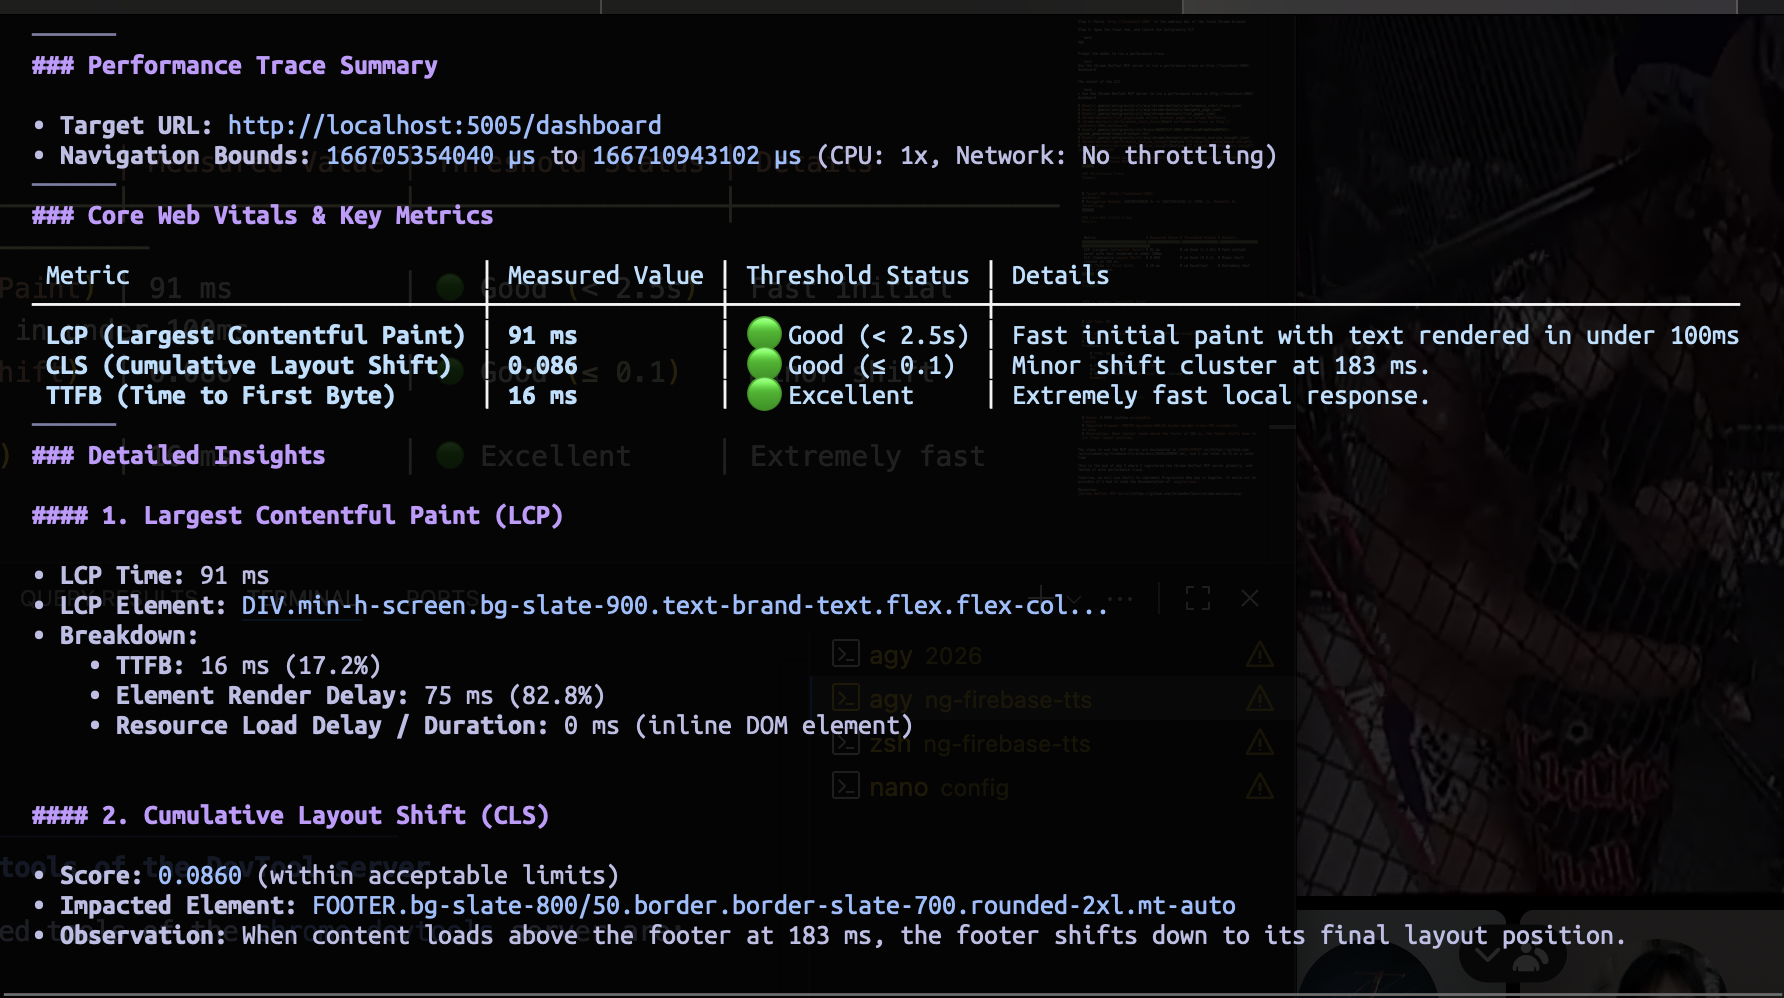
螢幕截圖顯示 Chrome DevTool MCP 伺服器執行了不同的工具來取得結果。
使用該 MCP 伺服器的步驟已記錄在 DEVELOPMENT.md 開發說明文件 中,我可以在日後參考
第 5 天到此結束,我在全域註冊了 Chrome DevTool MCP 伺服器,並使用效能追蹤對其進行了測試。
明天,我們將使用技能在 Angular 中實作 Progressive Web App。如果必須由我自己閱讀 angular/pwa 的文件,這將是不可能完成的任務。
Angular 在 Angular v22 中使用 Vitest,但 Angular 或 Vite 社群都沒有提供官方的 MCP 伺服器。因此,註冊了一個開源的 Vitest MCP 伺服器,以協助列出測試案例、對 spec 檔案進行偵錯,並促進涵蓋率分析。
npm i --save-dev @vitest/coverage-v8@4.1.11
"vitest": {
    "command": "npx",
    "args": ["-y", "@djankies/vitest-mcp"]
}
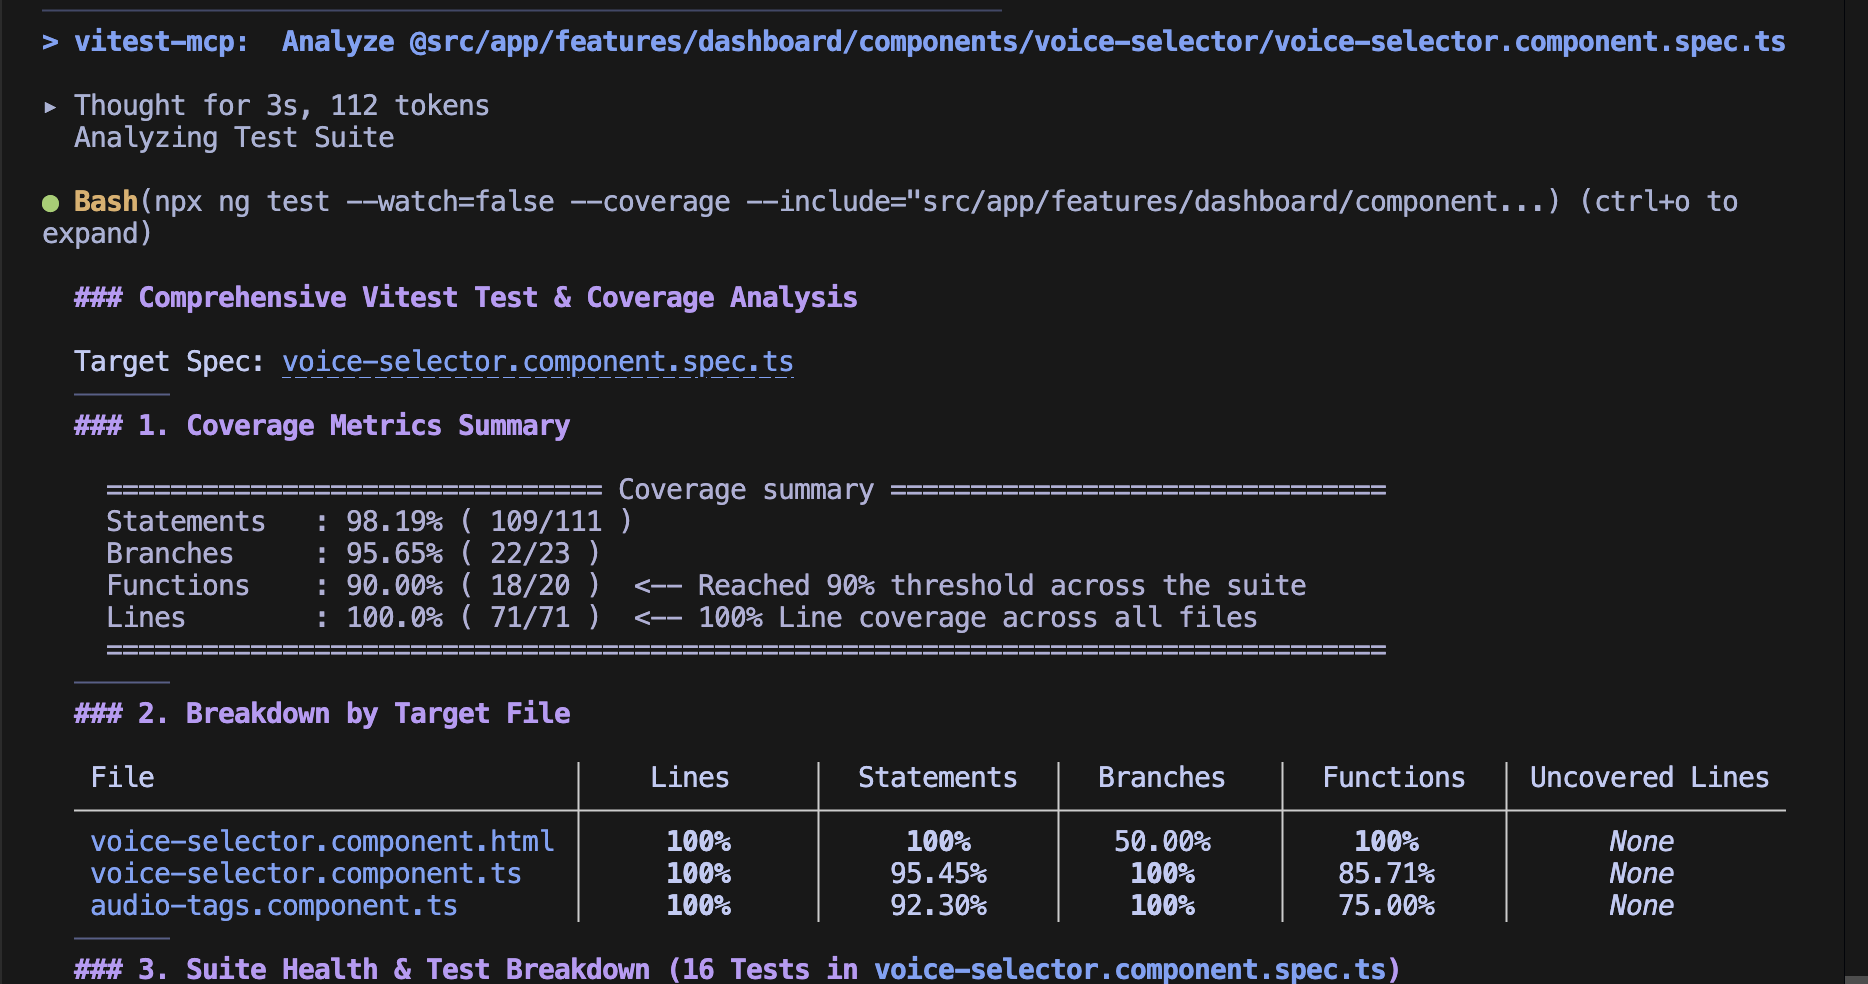
提示模型分析測試檔案
vitest-mcp: Analyze @[src/app/features/dashboard/components/voice-selector/voice-selector.component.spec.ts]
CLI 的輸出結果
相關資源:
Chrome DevTool MCP 伺服器
Vitest MCP 伺服器


 iThome鐵人賽
 看影片追技術