
接續昨天的路線圖,今天要讓步驟數量動態平均分布在 SVG path 上,也需要加上一條顯示當前進度的虛線。
事不宜遲,我們開始吧!
在 <path> 加上 stroke-dasharray 屬性,就能將線條改成虛線樣式,第一個數字代表多少單位的實線,第二個數字代表間隔多少單位的空白。
如果實線與間隔一致,可以只寫一個數值。
<path d="..." stroke-dasharray="16 12" />
<path d="..." stroke-dasharray="16" />
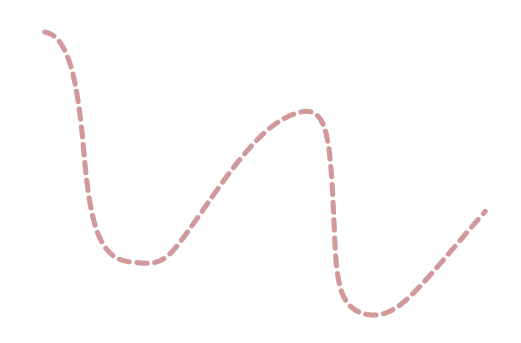
如果不想讓虛線死板地從起點開始,可以再加上 stroke-dashoffset 設定虛線要從哪裡開始算。數值越大,虛線就越往起點方向退。
<!-- 第一段實線只畫了一半 -->
<path d="..." stroke-dasharray="16 12" stroke-dashoffset="8" />
💡 offset 應用:將 offset 的終點值設定成
(實線單位 + 空格單位) × -1,加上animation變成無限流動的虛線,做出類似輸送帶、移動路徑的動態效果。@keyframes flow { to { stroke-dashoffset: -28; } /* 16 + 12,剛好一個循環 */ } path { animation: flow 1s linear infinite; }
進度線是要沿著完整路徑畫,並且只畫到當前進度。所以需要一條裁剪過的路徑,再給它虛線樣式。為了產生這條路徑,就需要知道「路徑上某個長度的位置在哪裡」,這就要靠 SVG DOM API 了。
SVG 元素在 JS 裡除了一般的 DOM 操作,還提供一些量測幾何資訊的方法。這次會用到下面幾個。
getTotalLength():路徑總長度getPointAtLength(length):沿著路徑走到某處的座標const pathEl = document.querySelector('path')
const total = pathEl.getTotalLength()
const point = pathEl.getPointAtLength(total * 0.5) // 走到一半
// 取得座標
const centerX = point.x
const centerY = point.y
有了這兩個 API,昨天「手動從 d 裡挑座標」的問題就解決了。動態設定 count 個步驟,就把路徑等分:
const count = 6
const total = pathEl.getTotalLength()

const points = Array.from({ length: count }, (_, index) => {
		// 計算比例:0, 0.2, 0.4 ... 1
    const ratio = count <= 1 ? 0 : index / (count - 1)
    return pathEl.getPointAtLength(total * ratio)
})
第一關在起點,最後一關在終點,中間依長度平均分佈。步驟數量怎麼變都能自動換算。
viewBox.baseVal:讀取 viewBox要把 viewBox 座標換算成畫面上的位置,得先知道 viewBox 的寬高。直覺會用 getAttribute:
svgEl.getAttribute('viewBox') // "0 0 900 600",是字串,還得自己拆
其實 SVG 元素已經幫我們解析好了,SVG 的屬性在 JS 裡大多是 SVGAnimated* 這類物件,包含:
baseVal:屬性原本設定的值。animVal:套用 SVG 動畫(SMIL)後,當下的值。svgEl.viewBox
svgEl.viewBox.baseVal // { x: 0, y: 0, width: 900, height: 600 }
const { width, height } = svgEl.viewBox.baseVal
SVG DOM API 都要透過 DOM 元素呼叫,所以先用 template ref 拿到 <svg> 與 <path>:
<script setup>
import { ref, computed } from "vue";

const ROADMAP_PATH_D = "M109.5 78.7C147.1 84.3 ...";

const LEVEL_POINTS = [ /* 同昨天 */ ];

const svgRef = ref(null);
const pathRef = ref(null);

const nodes = computed(() => {
  const svgEl = svgRef.value;
  if (!svgEl) return [];  // 第一次渲染時 DOM 還沒建立,ref 是 null

  const { width, height } = svgEl.viewBox.baseVal;

  return LEVEL_POINTS.map(({ x, y }) => ({
    style: {
      left: `${(x / width) * 100}%`,
      top: `${(y / height) * 100}%`,
    },
  }));
});
</script>

<template>
  <div class="roadmap">
    <svg ref="svgRef" viewBox="0 0 900 600">
      <path
        ref="pathRef"
        :d="ROADMAP_PATH_D"
        fill="none"
        stroke="#8b0000"
        stroke-width="40"
        stroke-linecap="round"
        opacity="0.4"
      />
    </svg>
    <!-- 節點同昨天 -->
  </div>
</template>
畫面和昨天一模一樣,不過寬高改從 viewBox.baseVal 讀取。以後設計稿換了 viewBox,只要改 template 一個地方就好。
💡
computed會追蹤svgRef,元件掛載後 ref 才會變成 DOM 元素。而在畫面初始化當下的值為null,如果沒有做檢查,第一次渲染就會報錯。
把寫死的 LEVEL_POINTS 刪掉,改用步驟數量 stepCount 搭配 SVG API 算出座標:
const stepCount = ref(6);

// 第 index 步在整條路徑上的長度比例
const ratioAt = (index) => stepCount.value <= 1 ? 0 : index / (stepCount.value - 1);

const nodes = computed(() => {
  const svgEl = svgRef.value;
  const pathEl = pathRef.value;
  if (!svgEl || !pathEl) return [];

  const { width, height } = svgEl.viewBox.baseVal;
  const total = pathEl.getTotalLength();

  return Array.from({ length: stepCount.value }, (_, index) => {
	  // 總長度 * 長度比例 = 目標長度
    const { x, y } = pathEl.getPointAtLength(total * ratioAt(index));
    return {
      style: {
        left: `${(x / width) * 100}%`,
        top: `${(y / height) * 100}%`,
      },
    };
  });
});
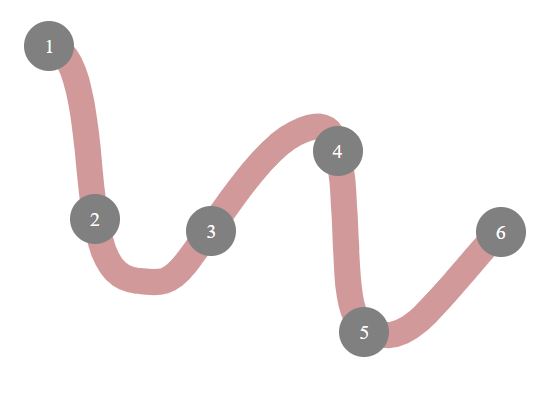
這樣 6 個節點依路徑長度平均分佈。比手挑位置的間距平均多了。步驟數量改變時,調整 stepCount 即可。
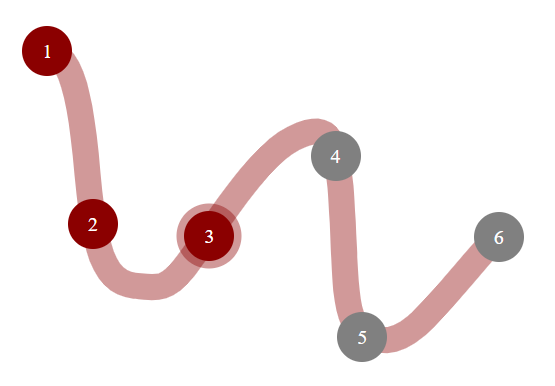
依 currentCount 判斷每一步驟是已完成、目前所在,還是未解鎖:
const currentCount = ref(2);

// nodes 的 return 多加 status
return {
  status:
    index < currentCount.value ? "completed"
    : index === currentCount.value ? "current"
    : "locked",
  style: { /* 同上 */ },
};
然後在步驟圓圈上綁 class ,並設定對應 CSS 樣式。
<div
  v-for="(node, index) in nodes"
  :key="index"
  class="roadmap__node"
  :class="`is-${node.status}`"
  :style="node.style"
>
  {{ index + 1 }}
</div>
.is-completed,.is-current { background: #8b0000; }
.is-current { box-shadow: 0 0 0 6px rgba(139, 0, 0, 0.4); }
沿著路徑取樣,組出一條只到目前步驟的新路徑。
buildPartialPath() 做了:
getPointAtLength(0) 取得起點,寫成 M。sampleStep(3 單位)取一個點,用 L 直線串起來。endLen 的終點,確保虛線精準停在步驟上。// 沿完整 path 取樣,組出「畫到 ratio 為止」的子路徑 d
const buildPartialPath = (pathEl, ratio, sampleStep = 3) => {
if (ratio <= 0) return "";
const total = pathEl.getTotalLength();
const endLen = total * Math.min(ratio, 1);
const startPt = pathEl.getPointAtLength(0);
let d = `M${startPt.x} ${startPt.y}`;
for (let len = sampleStep; len < endLen; len += sampleStep) {
const pt = pathEl.getPointAtLength(len);
d += ` L${pt.x} ${pt.y}`;
}
const endPt = pathEl.getPointAtLength(endLen);
d += ` L${endPt.x} ${endPt.y}`;
return d;
};
const progressD = computed(() => {
const pathEl = pathRef.value;
if (!pathEl) return "";
return buildPartialPath(pathEl, ratioAt(currentCount.value));
});
在 <svg> 裡加上第二條 path,畫在路線上方:
<svg ref="svgRef" viewBox="0 0 900 600">
  <path ref="pathRef" ... />
  <path
    :d="progressD"
    fill="none"
    stroke="#8b0000"
    stroke-width="6"
    stroke-linecap="round"
    stroke-dasharray="16 12"
  />
</svg>
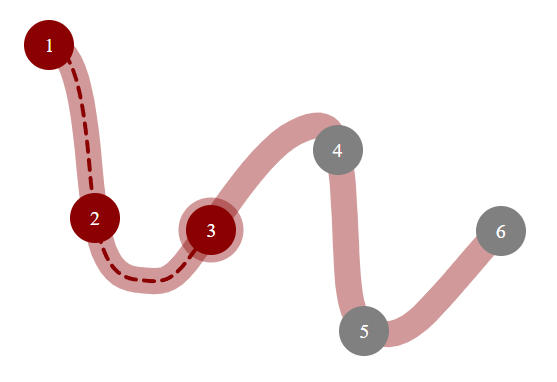
因為點取得夠密,折線看起來就和原本的曲線一樣。
💡
sampleStep越小,曲線越平滑,但路徑的點也越多。路徑長約 1400,每 3 單位取一點,大約四百多個點,效能上完全沒問題。如果是較複雜的路徑,可以考慮改用<mask>只露出要顯示的部分。
縮放瀏覽器視窗時,節點和虛線也都會貼著路線。這是因為節點用百分比定位,容器又用 aspect-ratio 鎖住比例,所以不需要監聽 resize。

Codepen 連結
.
.
.
好咧!SVG 介紹告一段落。
我們從基礎介紹,到結合 CSS、前端框架 template 操作、JavaScript 這些進階應用。也看到前端可以用 SVG 實現動態圖形,讓專案更好維護
明天,將進入新的篇章——「主題色系」。祝大家中秋節快樂!🌕🥮



 iThome鐵人賽
 看影片追技術